Summary
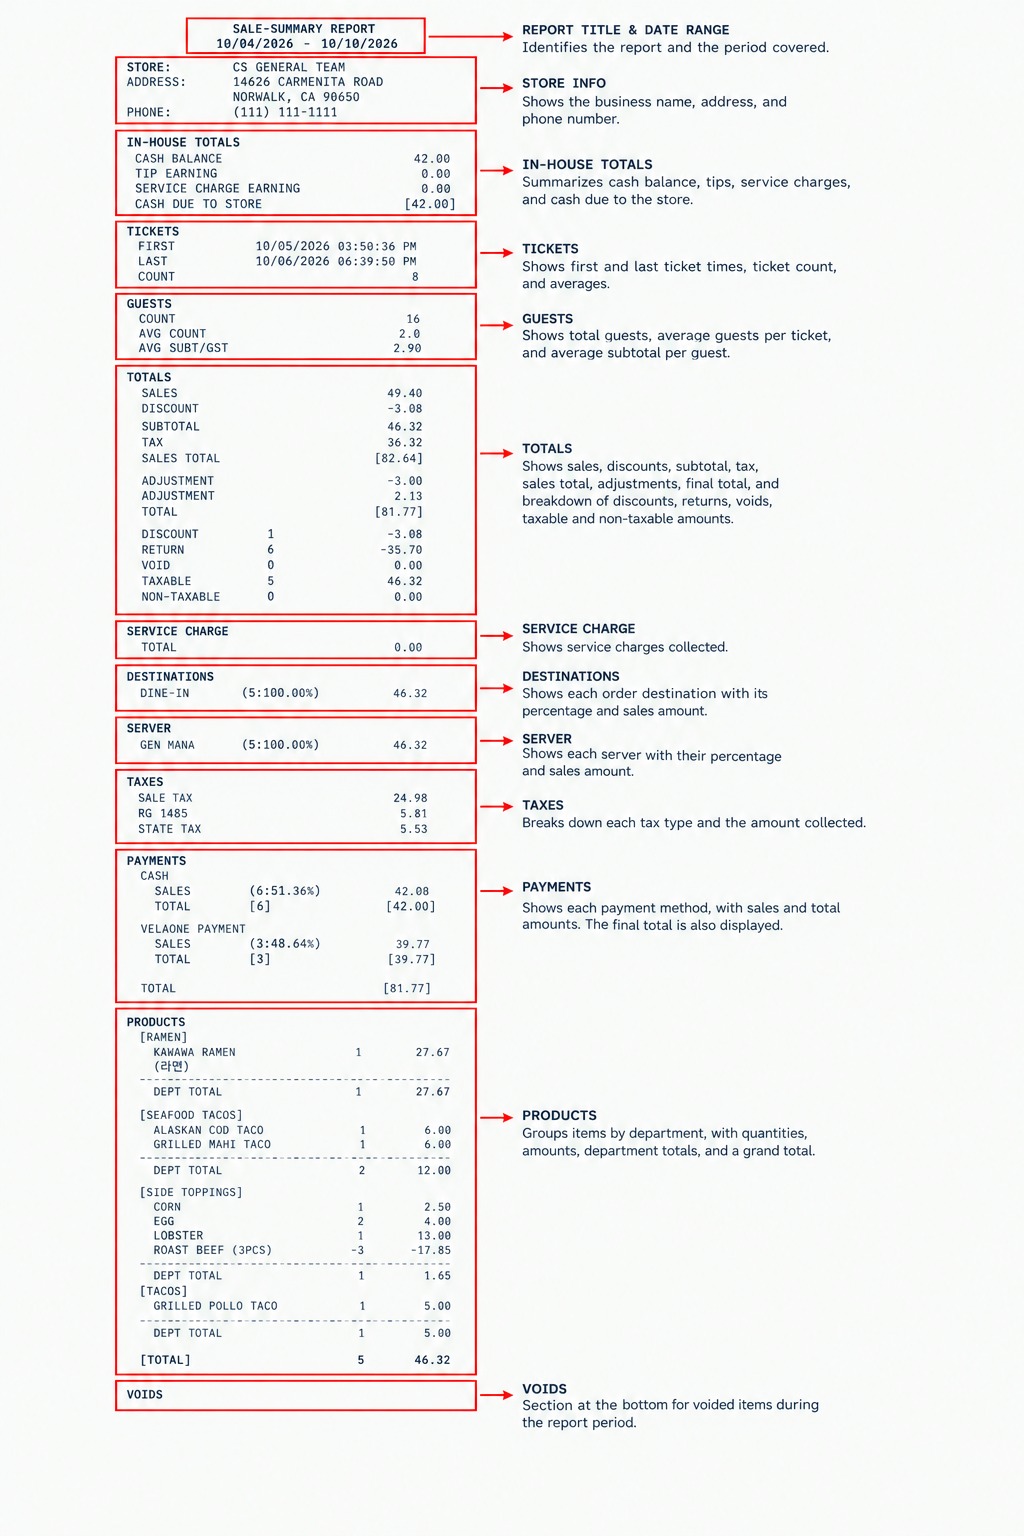
The Sales Summary Report displays a consolidated overview of sales activity for a selected period, including totals, ticket counts, guest counts, payment breakdowns, taxes, and product sales. Use it to review business performance.
Main Screen> MENU> SETTINGS> SALES> SUMMARY
From the Main Screen, go to MENU, and select REPORTS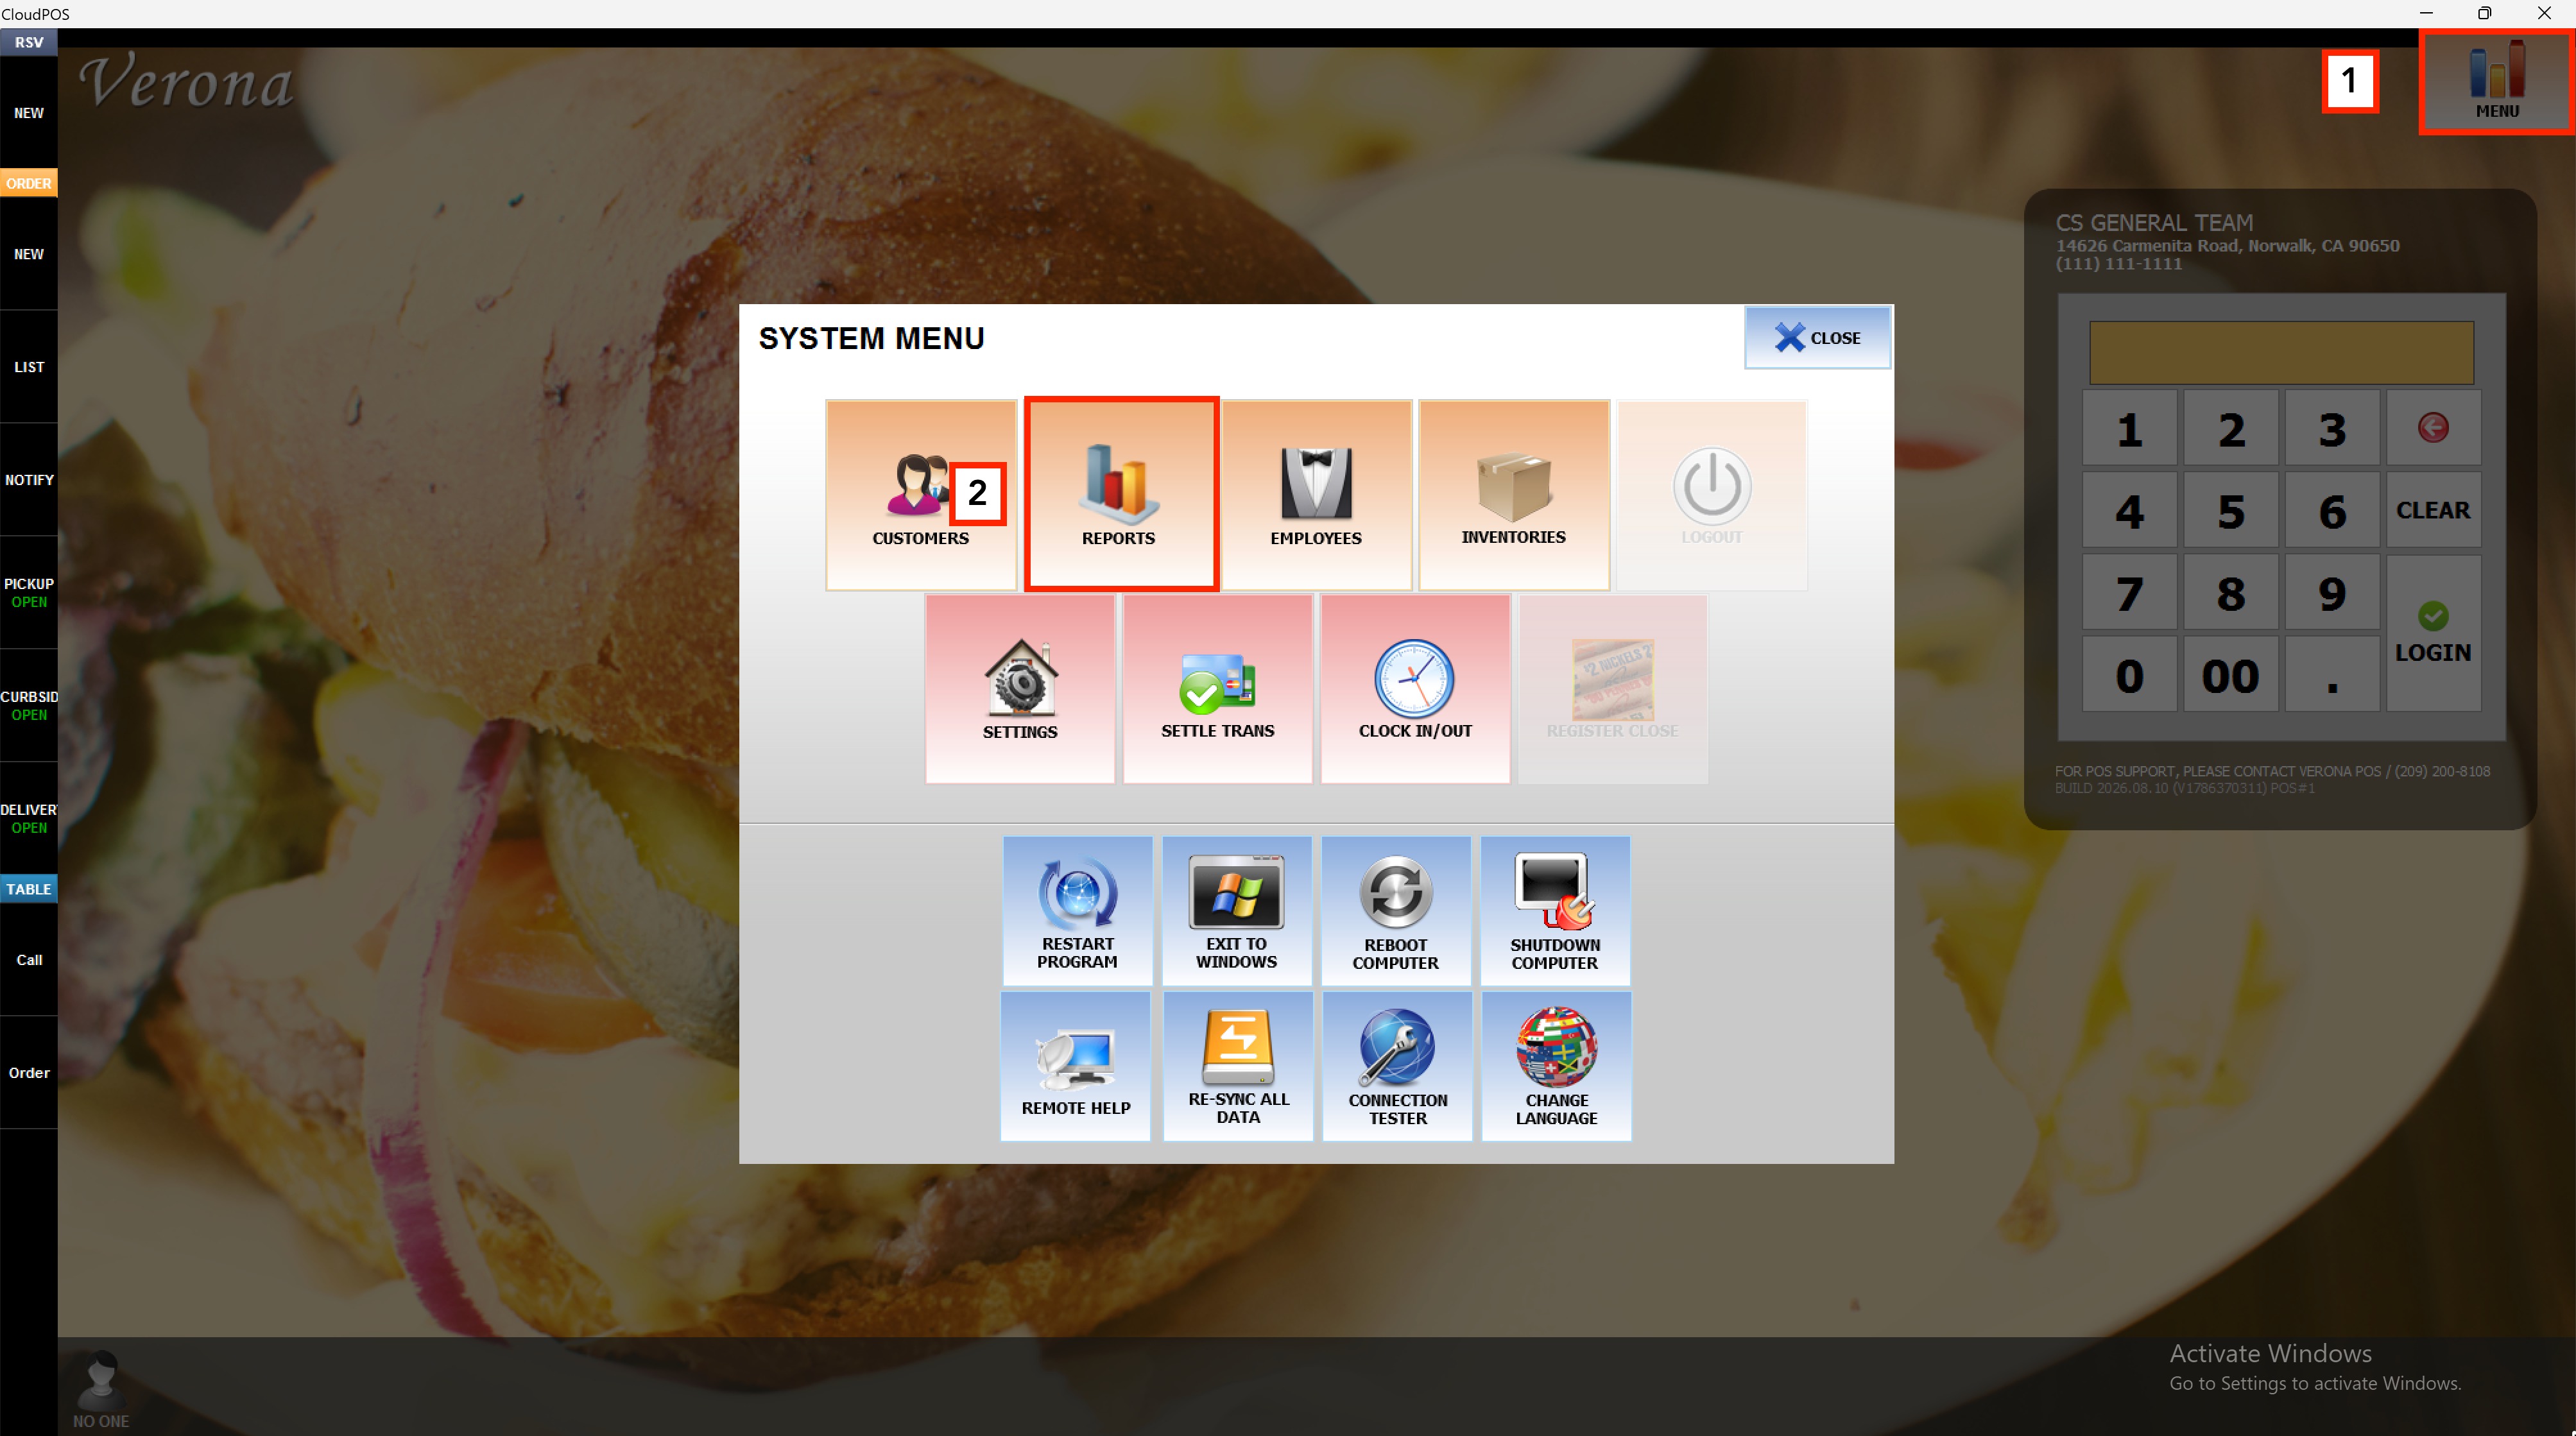
Go to SALES and choose the SUMMARY tab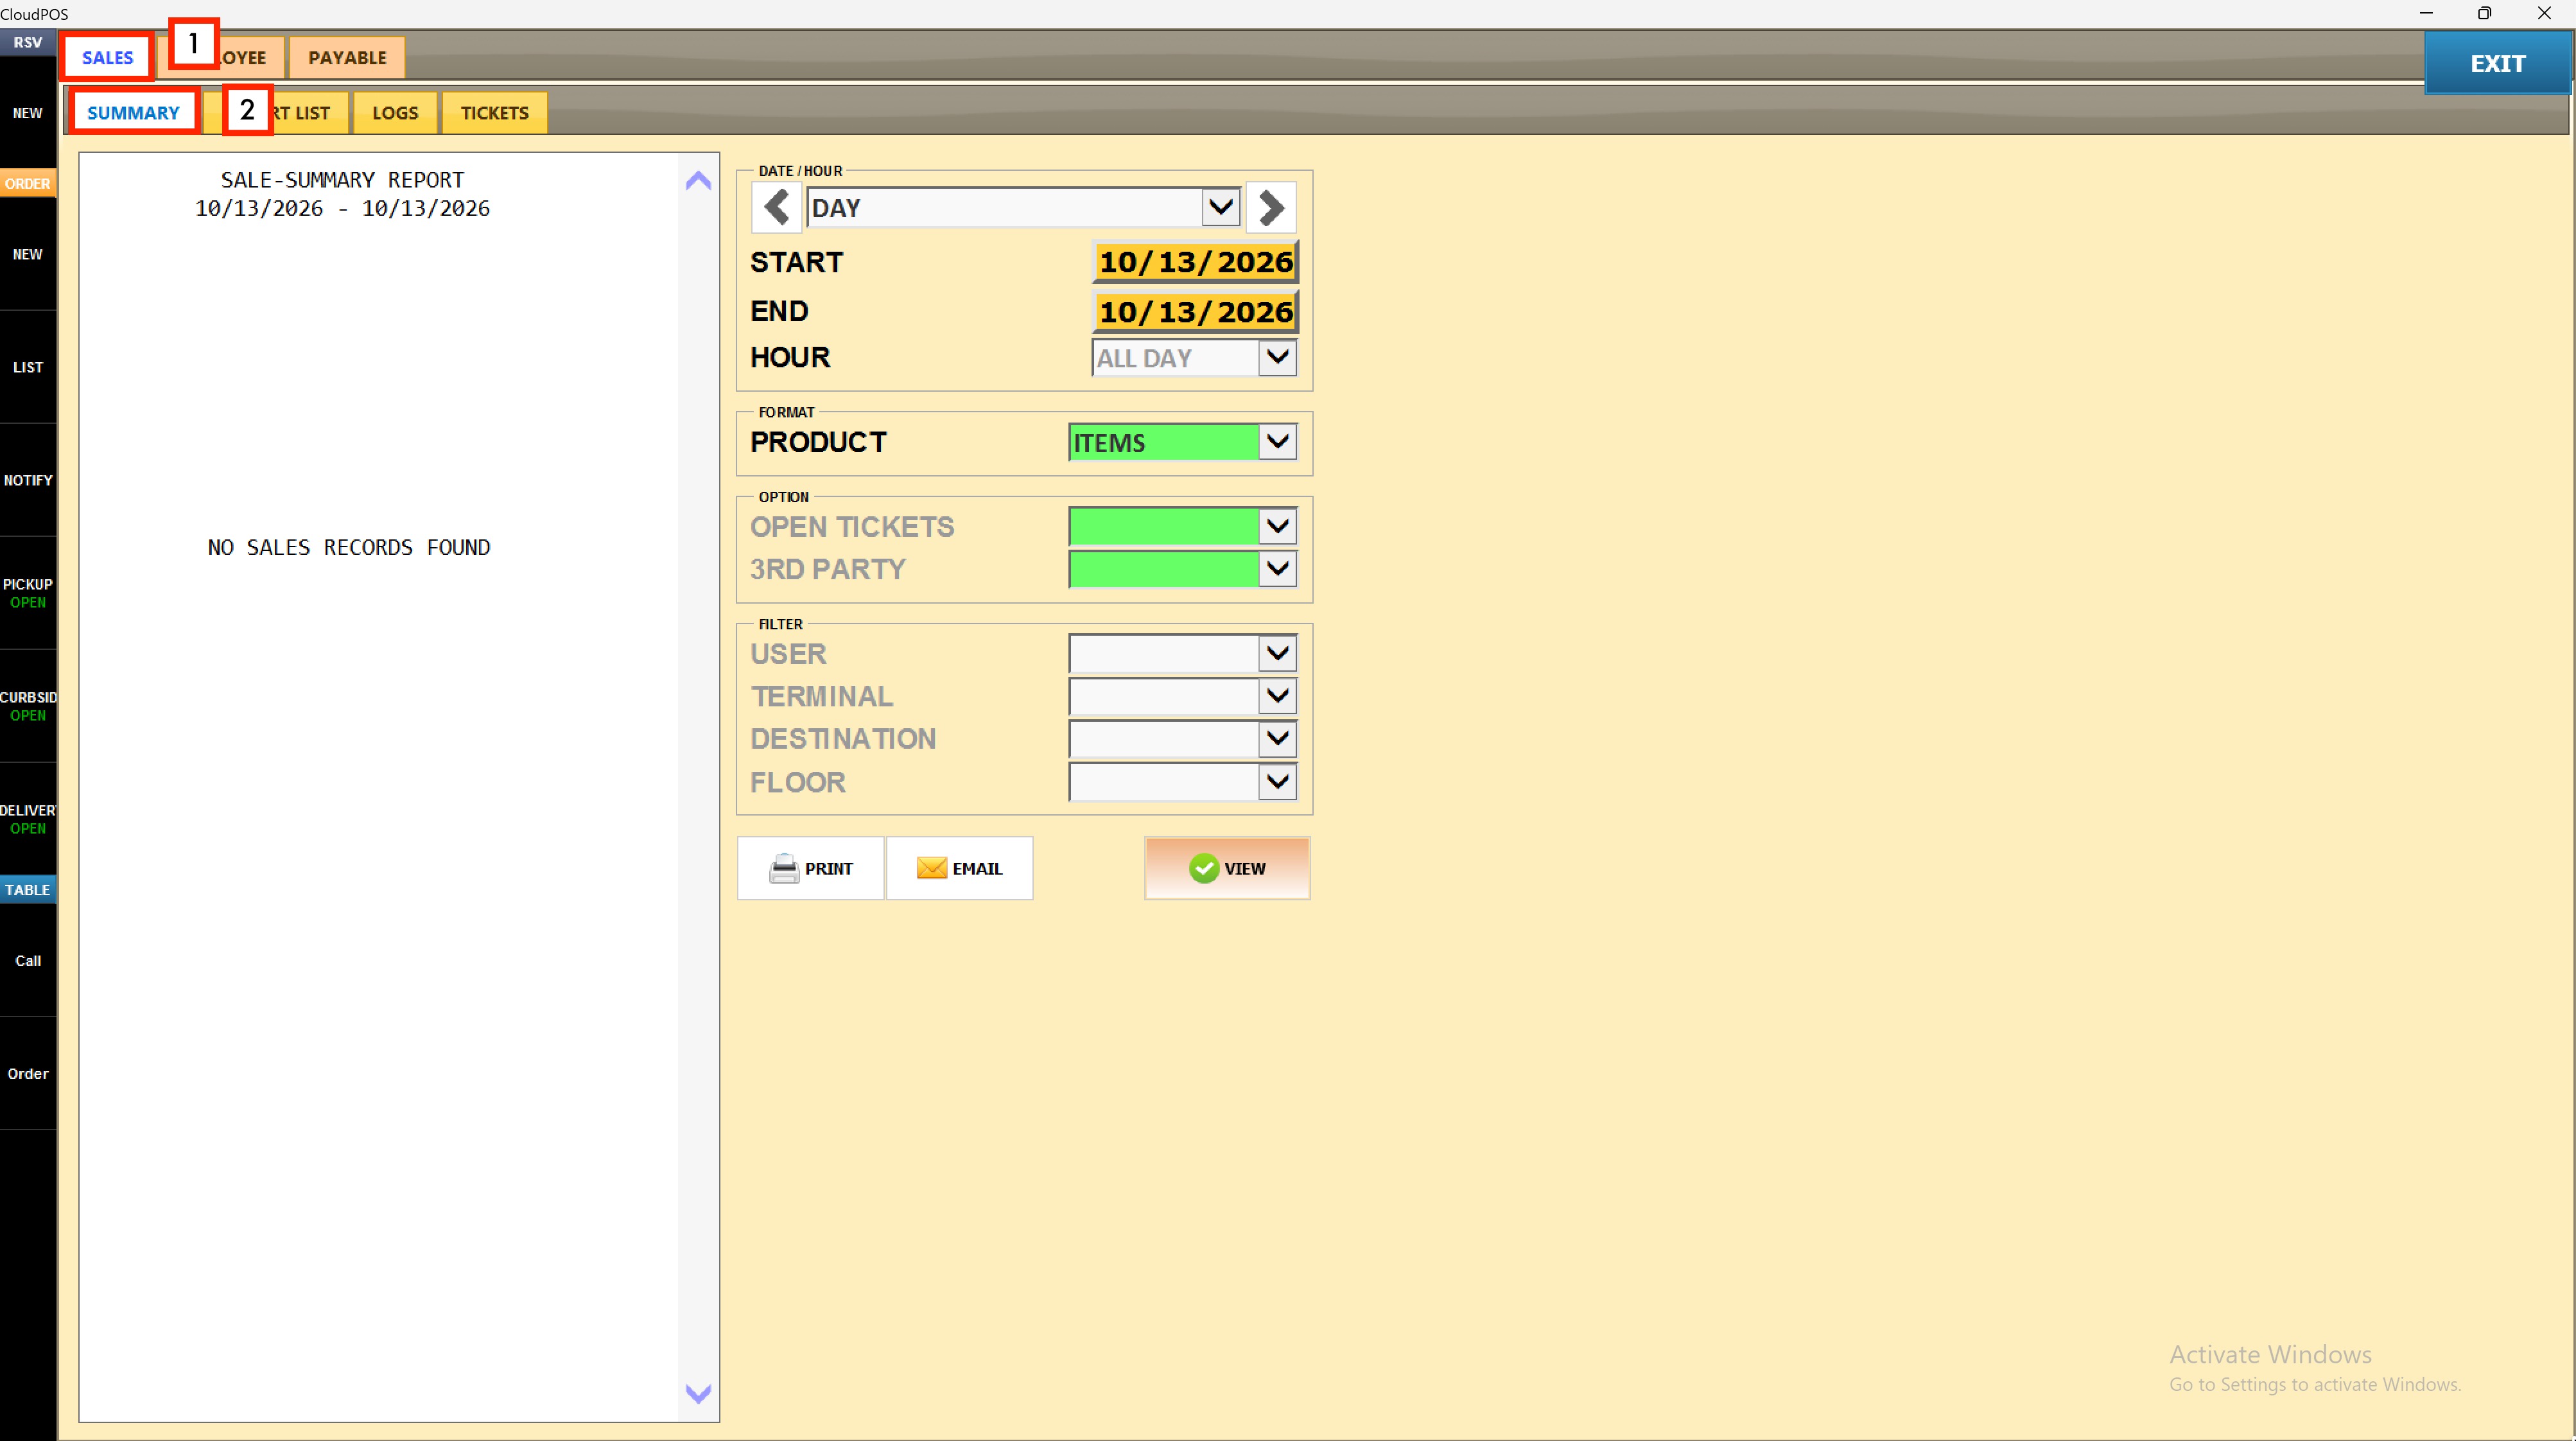
Filters:
Use the panel on the right side to customize how the report is displayed
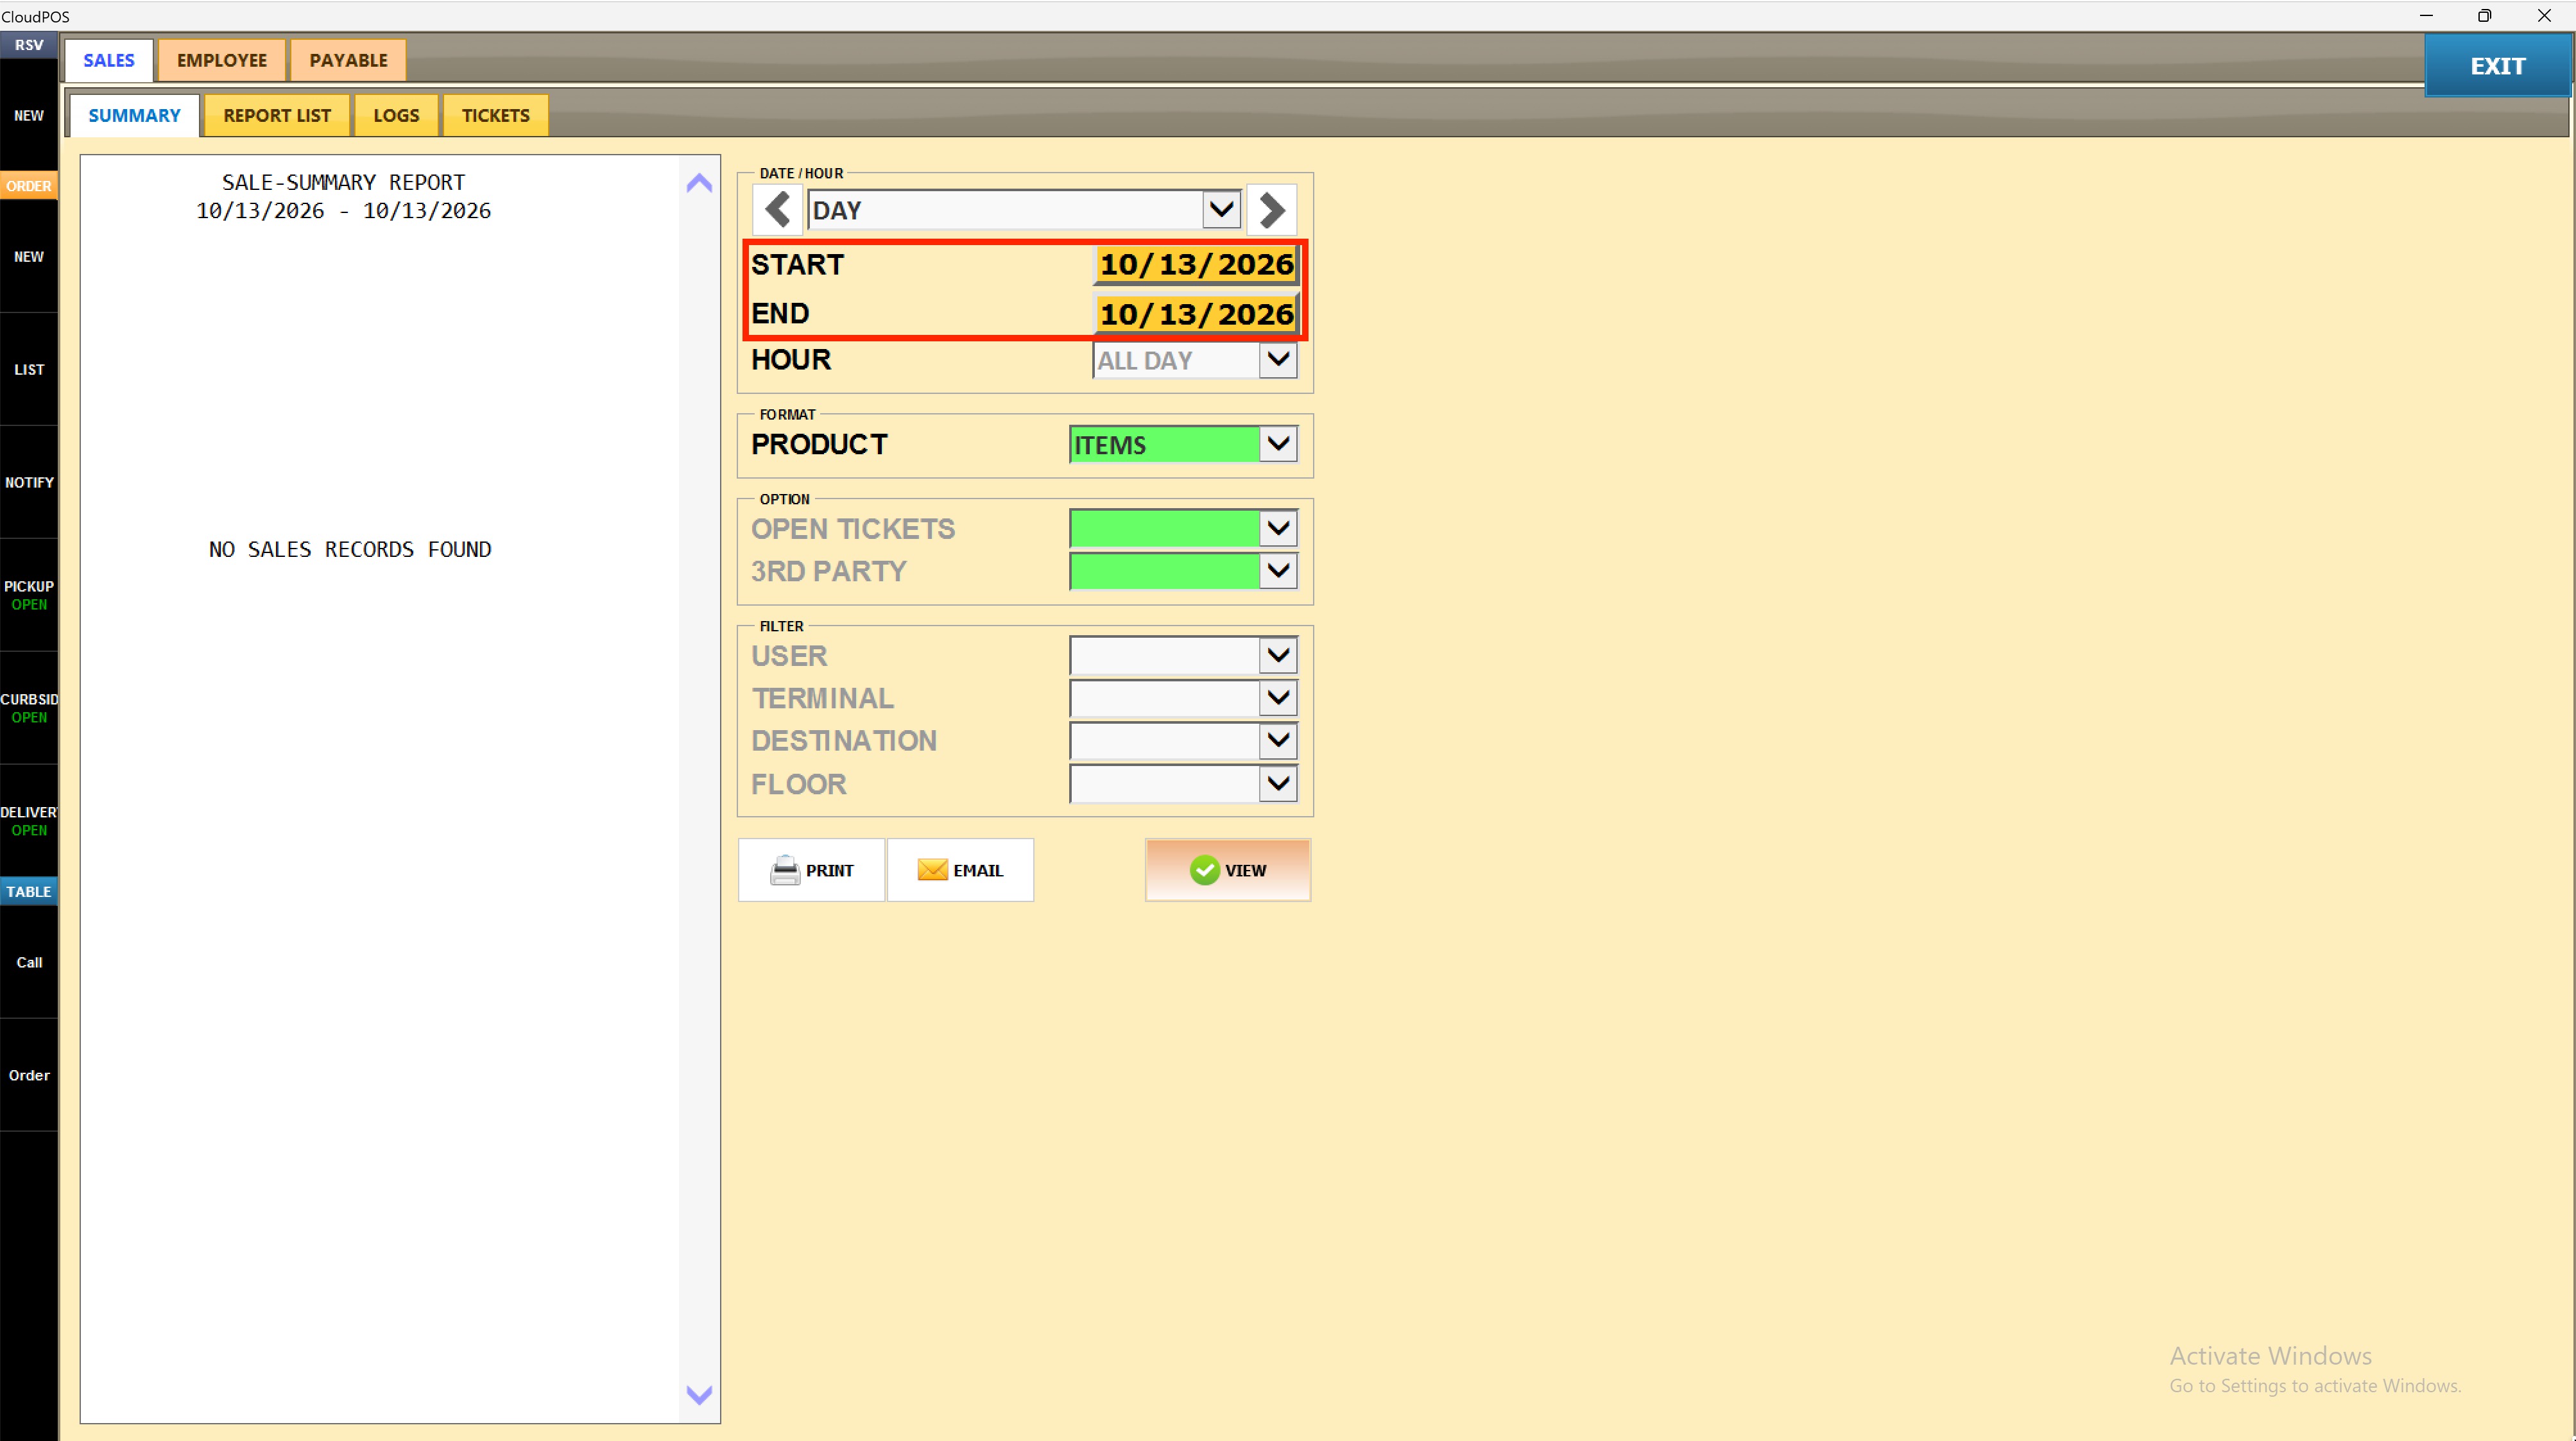
1. Set the Date Range
Select a preset period from the DATE/HOUR dropdown: DAY, WEEK, MONTH, QUARTER, or YEAR. The START and END dates update automatically. To report on a specific range, tap the START or END date field and enter the desired dates.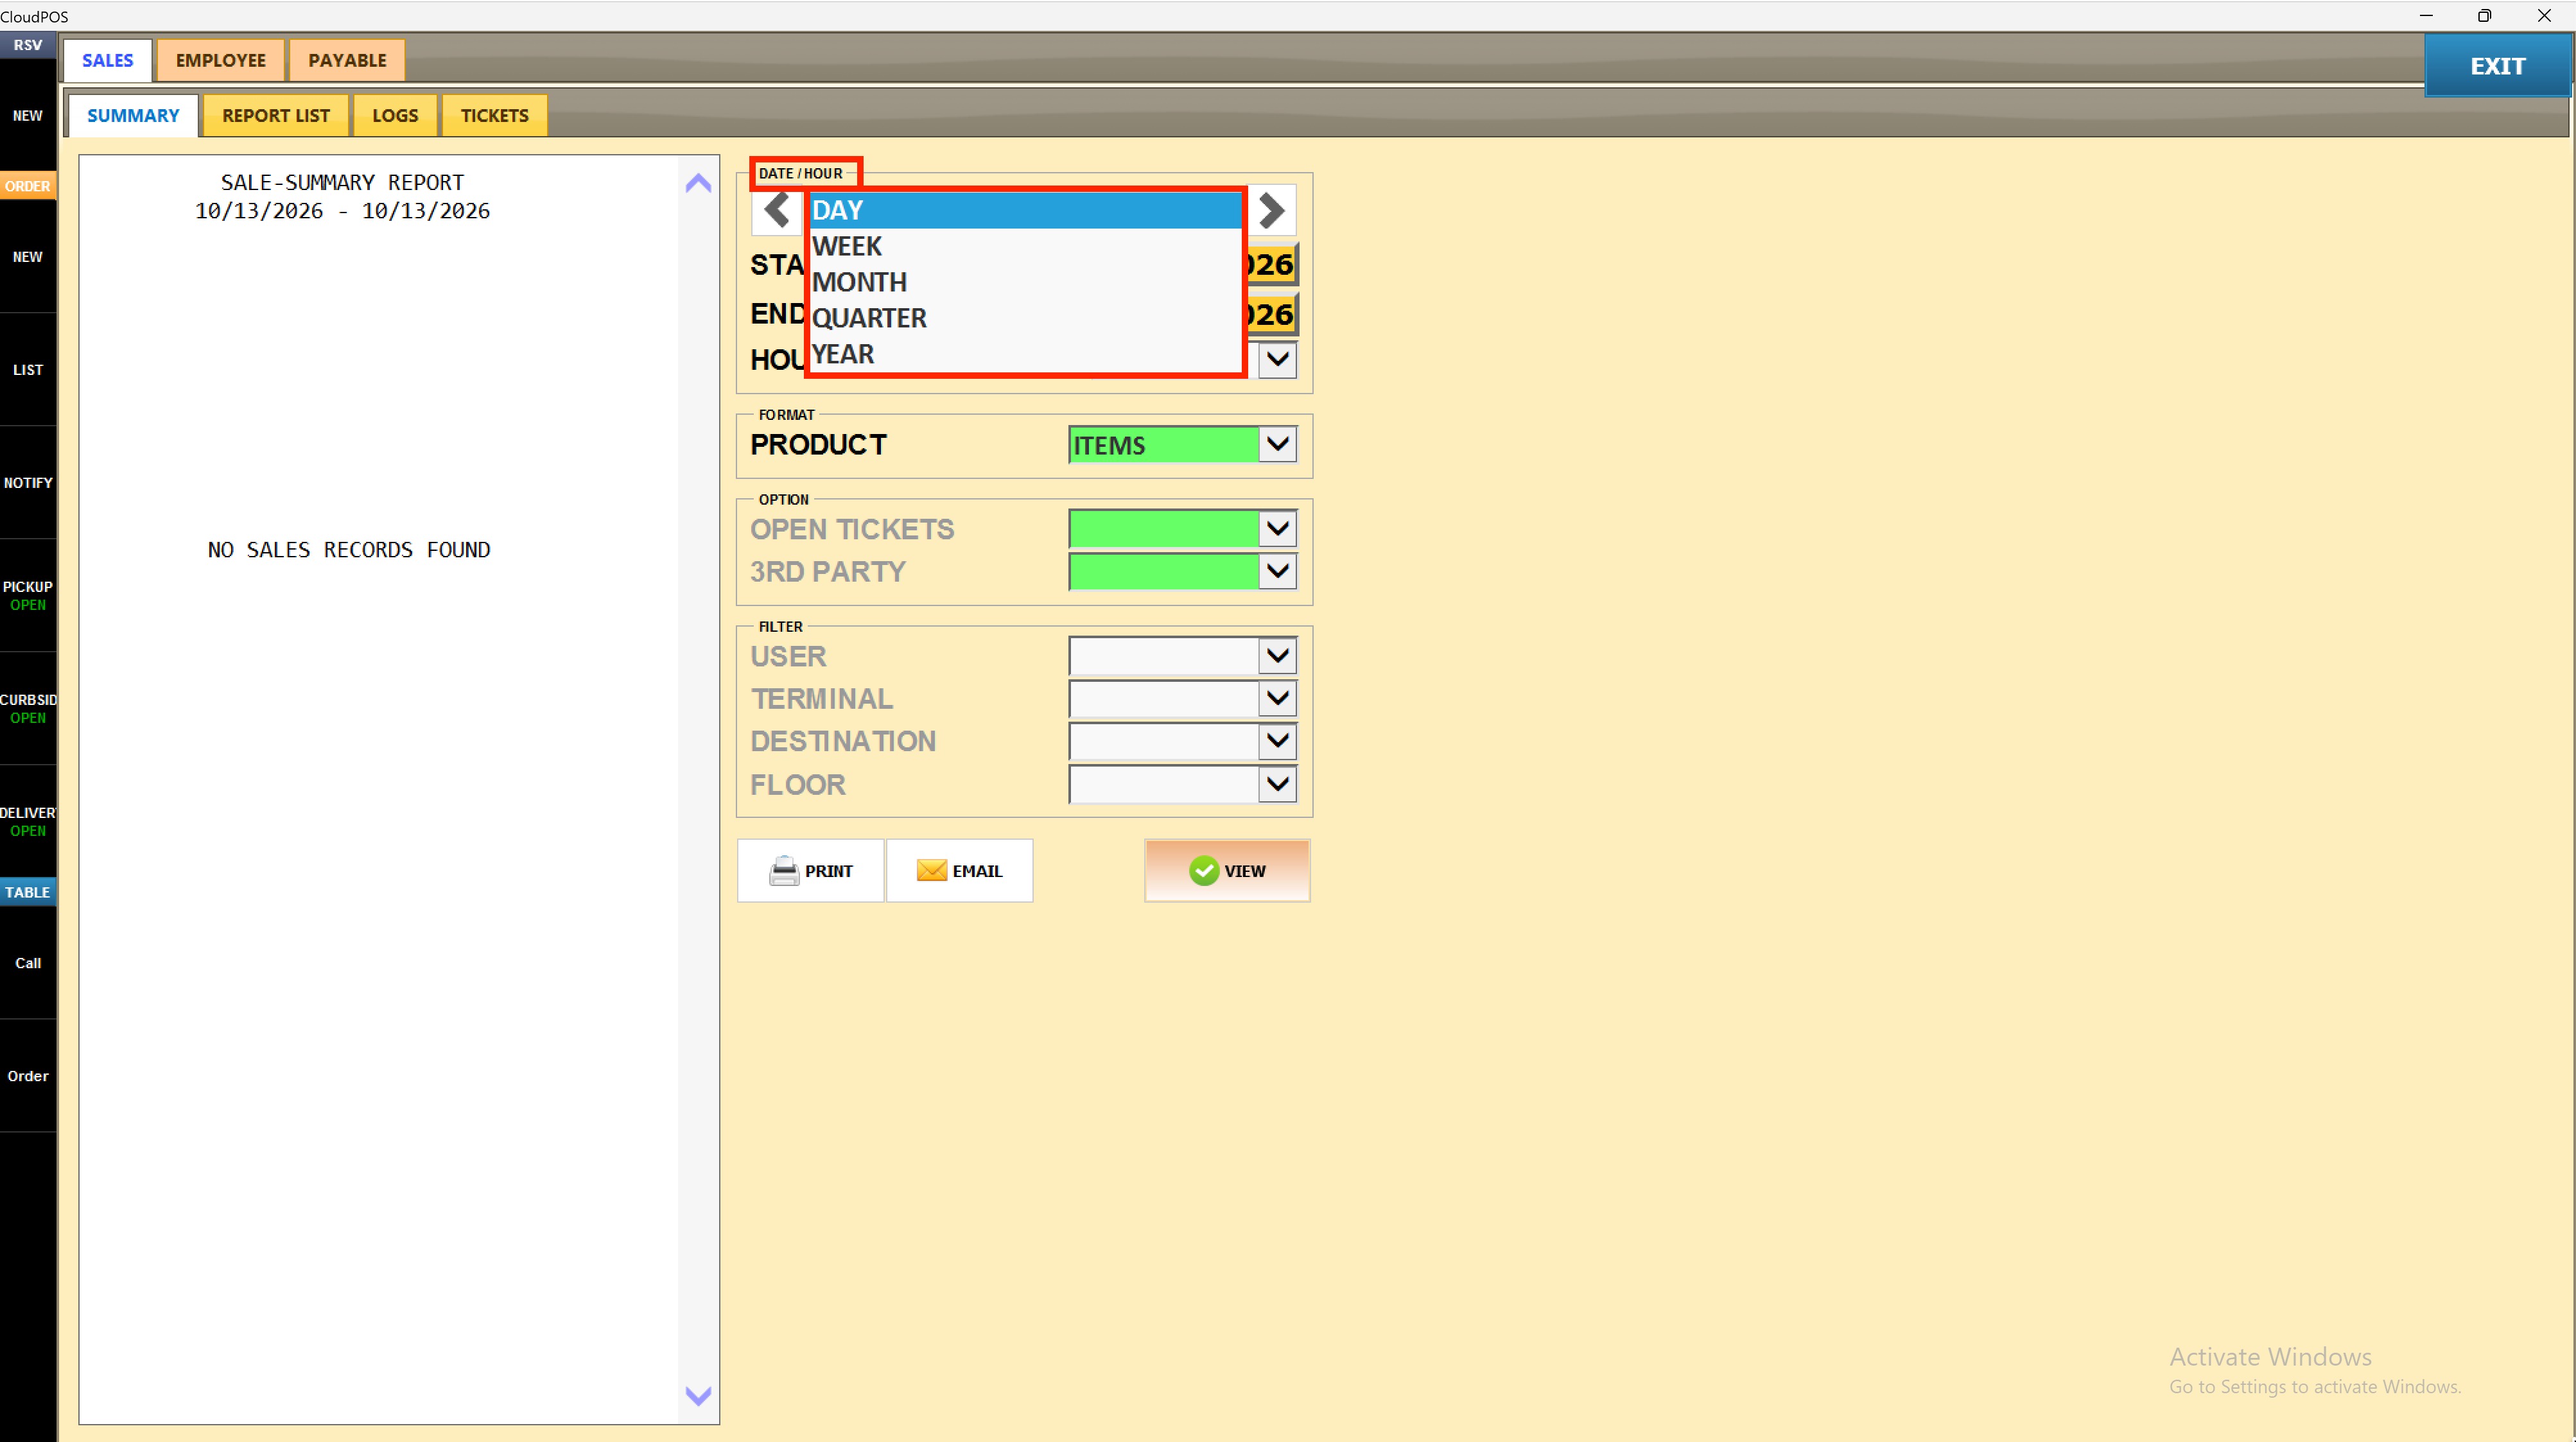
2. Set the Hour Filter
Select a value from the HOUR dropdown to limit results to a specific service period. Options include ALL DAY, EARLY, BREAKFAST, BRUNCH, LUNCH, DINNER, LATE, HAPPY, and individual hour slots (H1–H9). Leave set to ALL DAY to include all hours.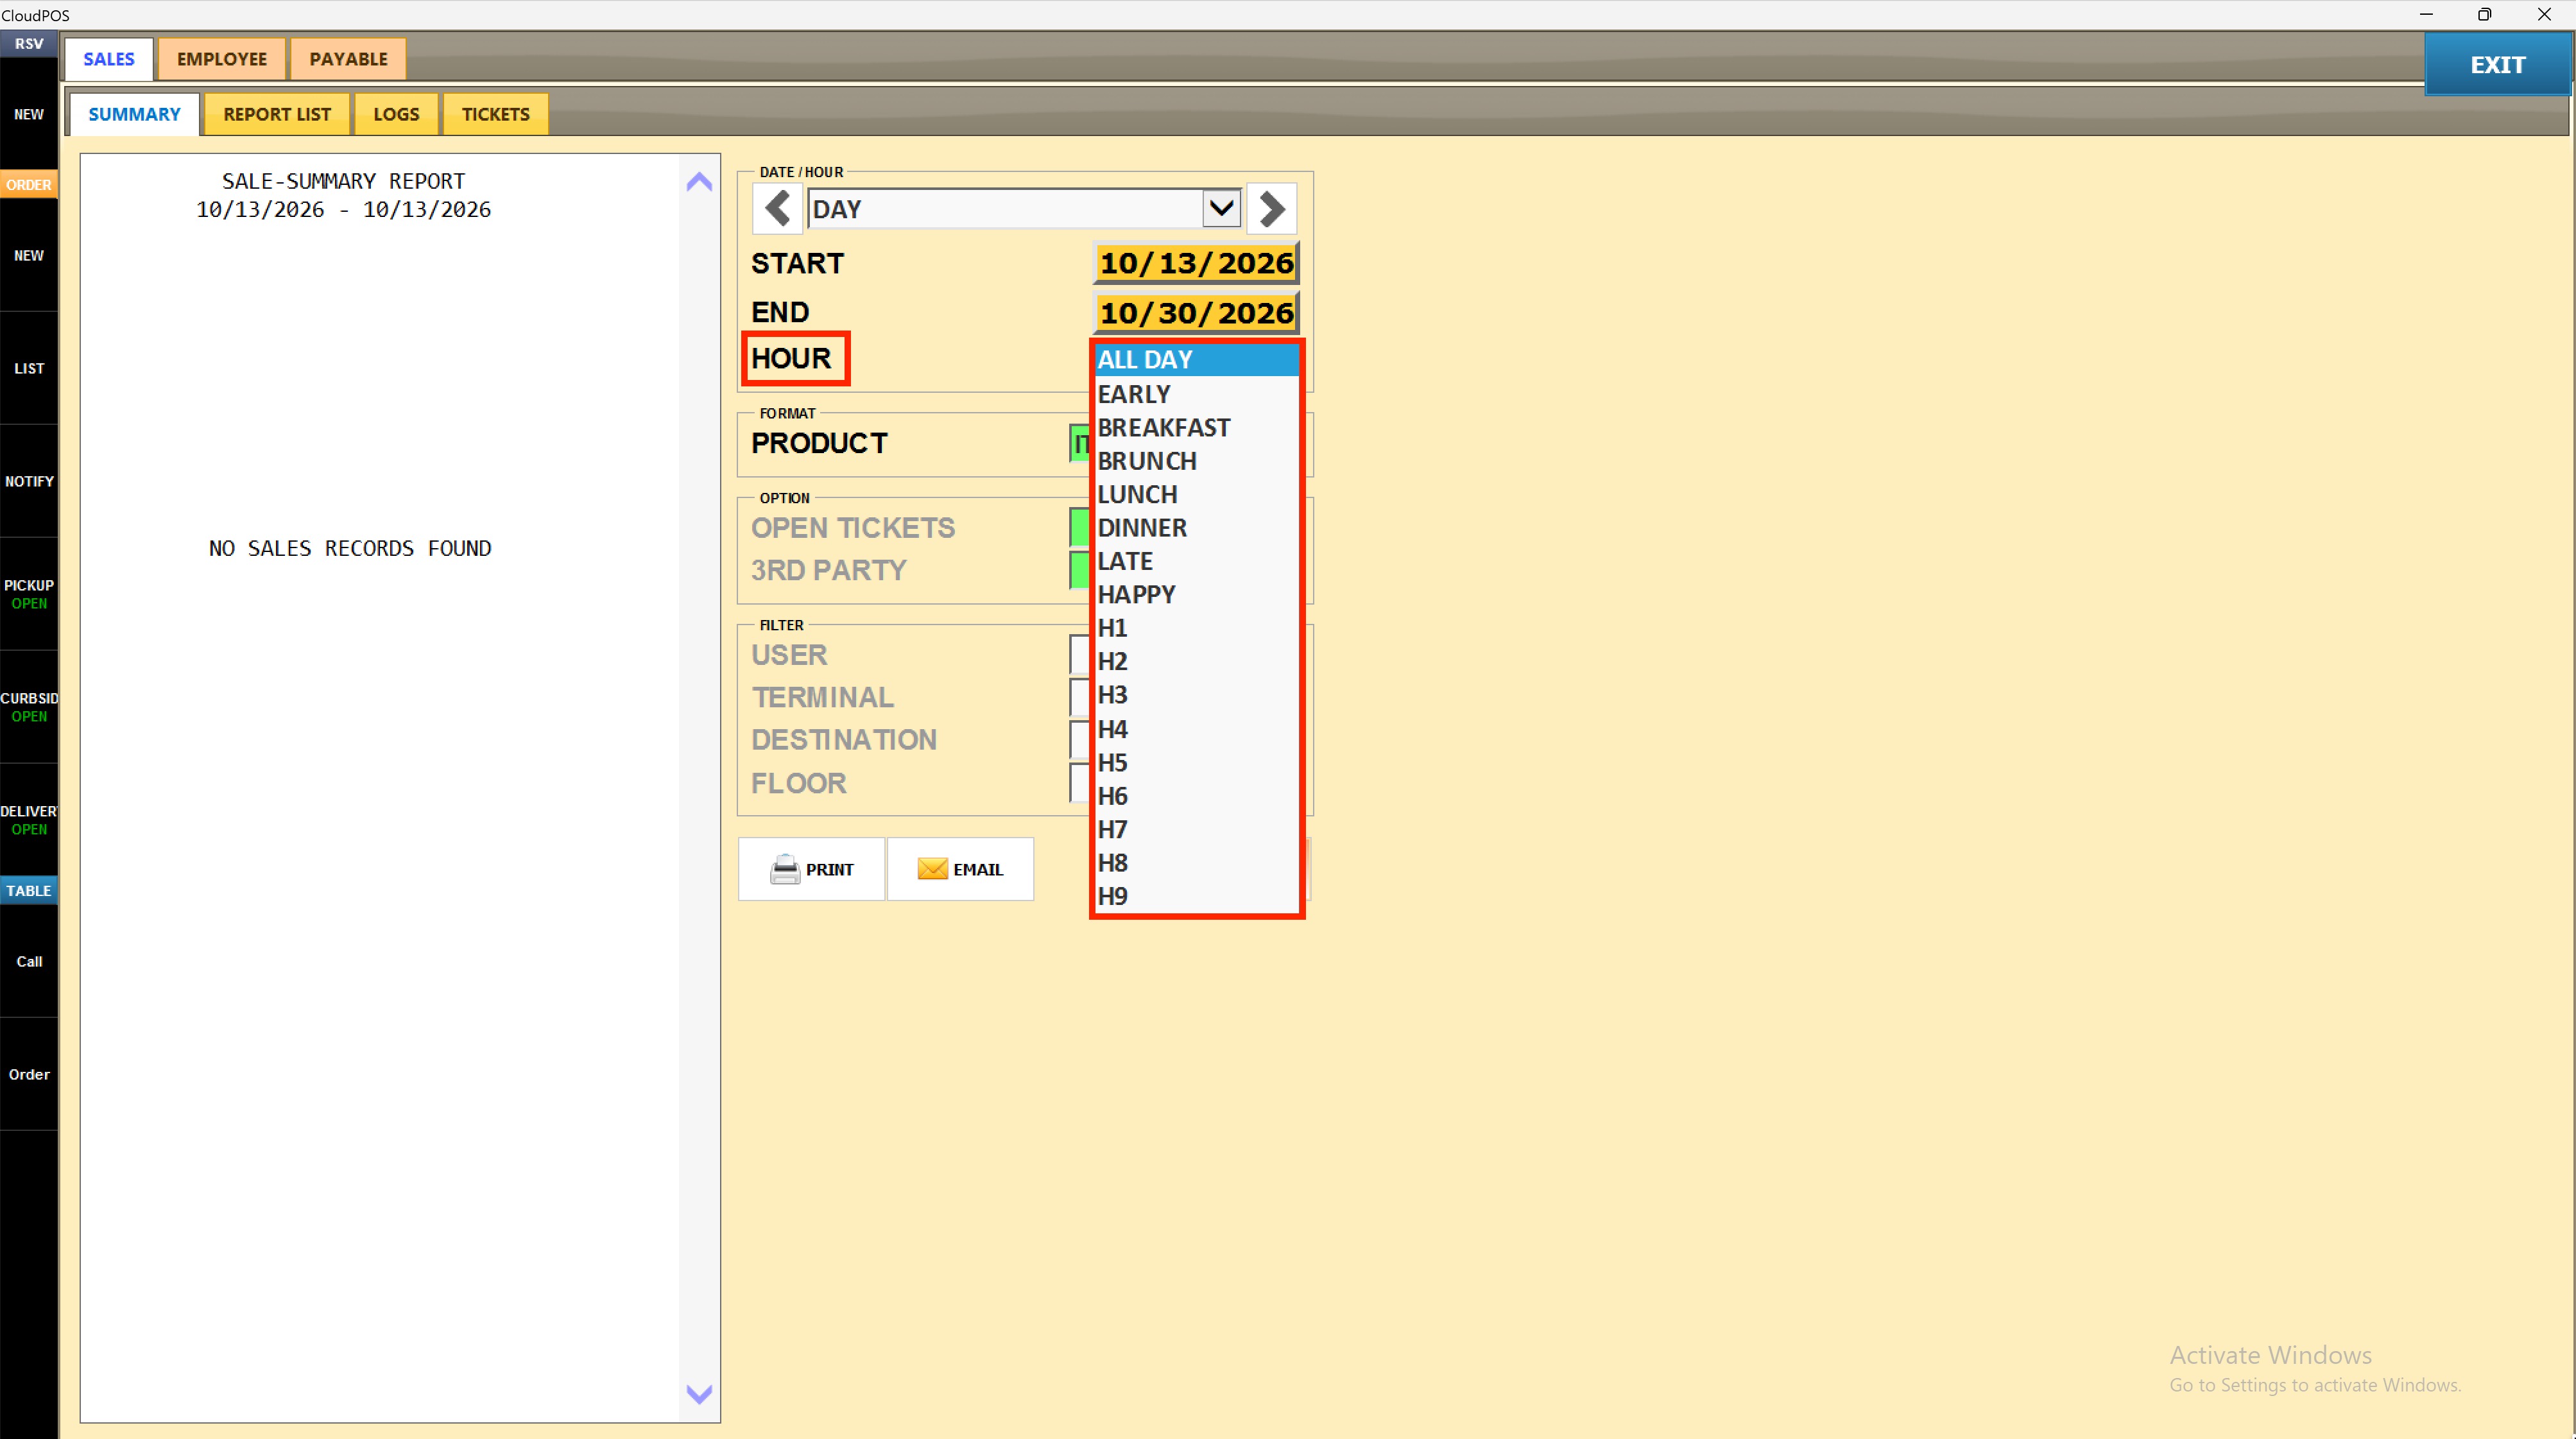
3. Set the Product Format
Select a value from the PRODUCT dropdown under FORMAT to control how product sales appear on the report:
NONE: omits the product breakdown.
DEPARTMENTS: groups sales by department only.
ITEMS: lists each item individually under its department.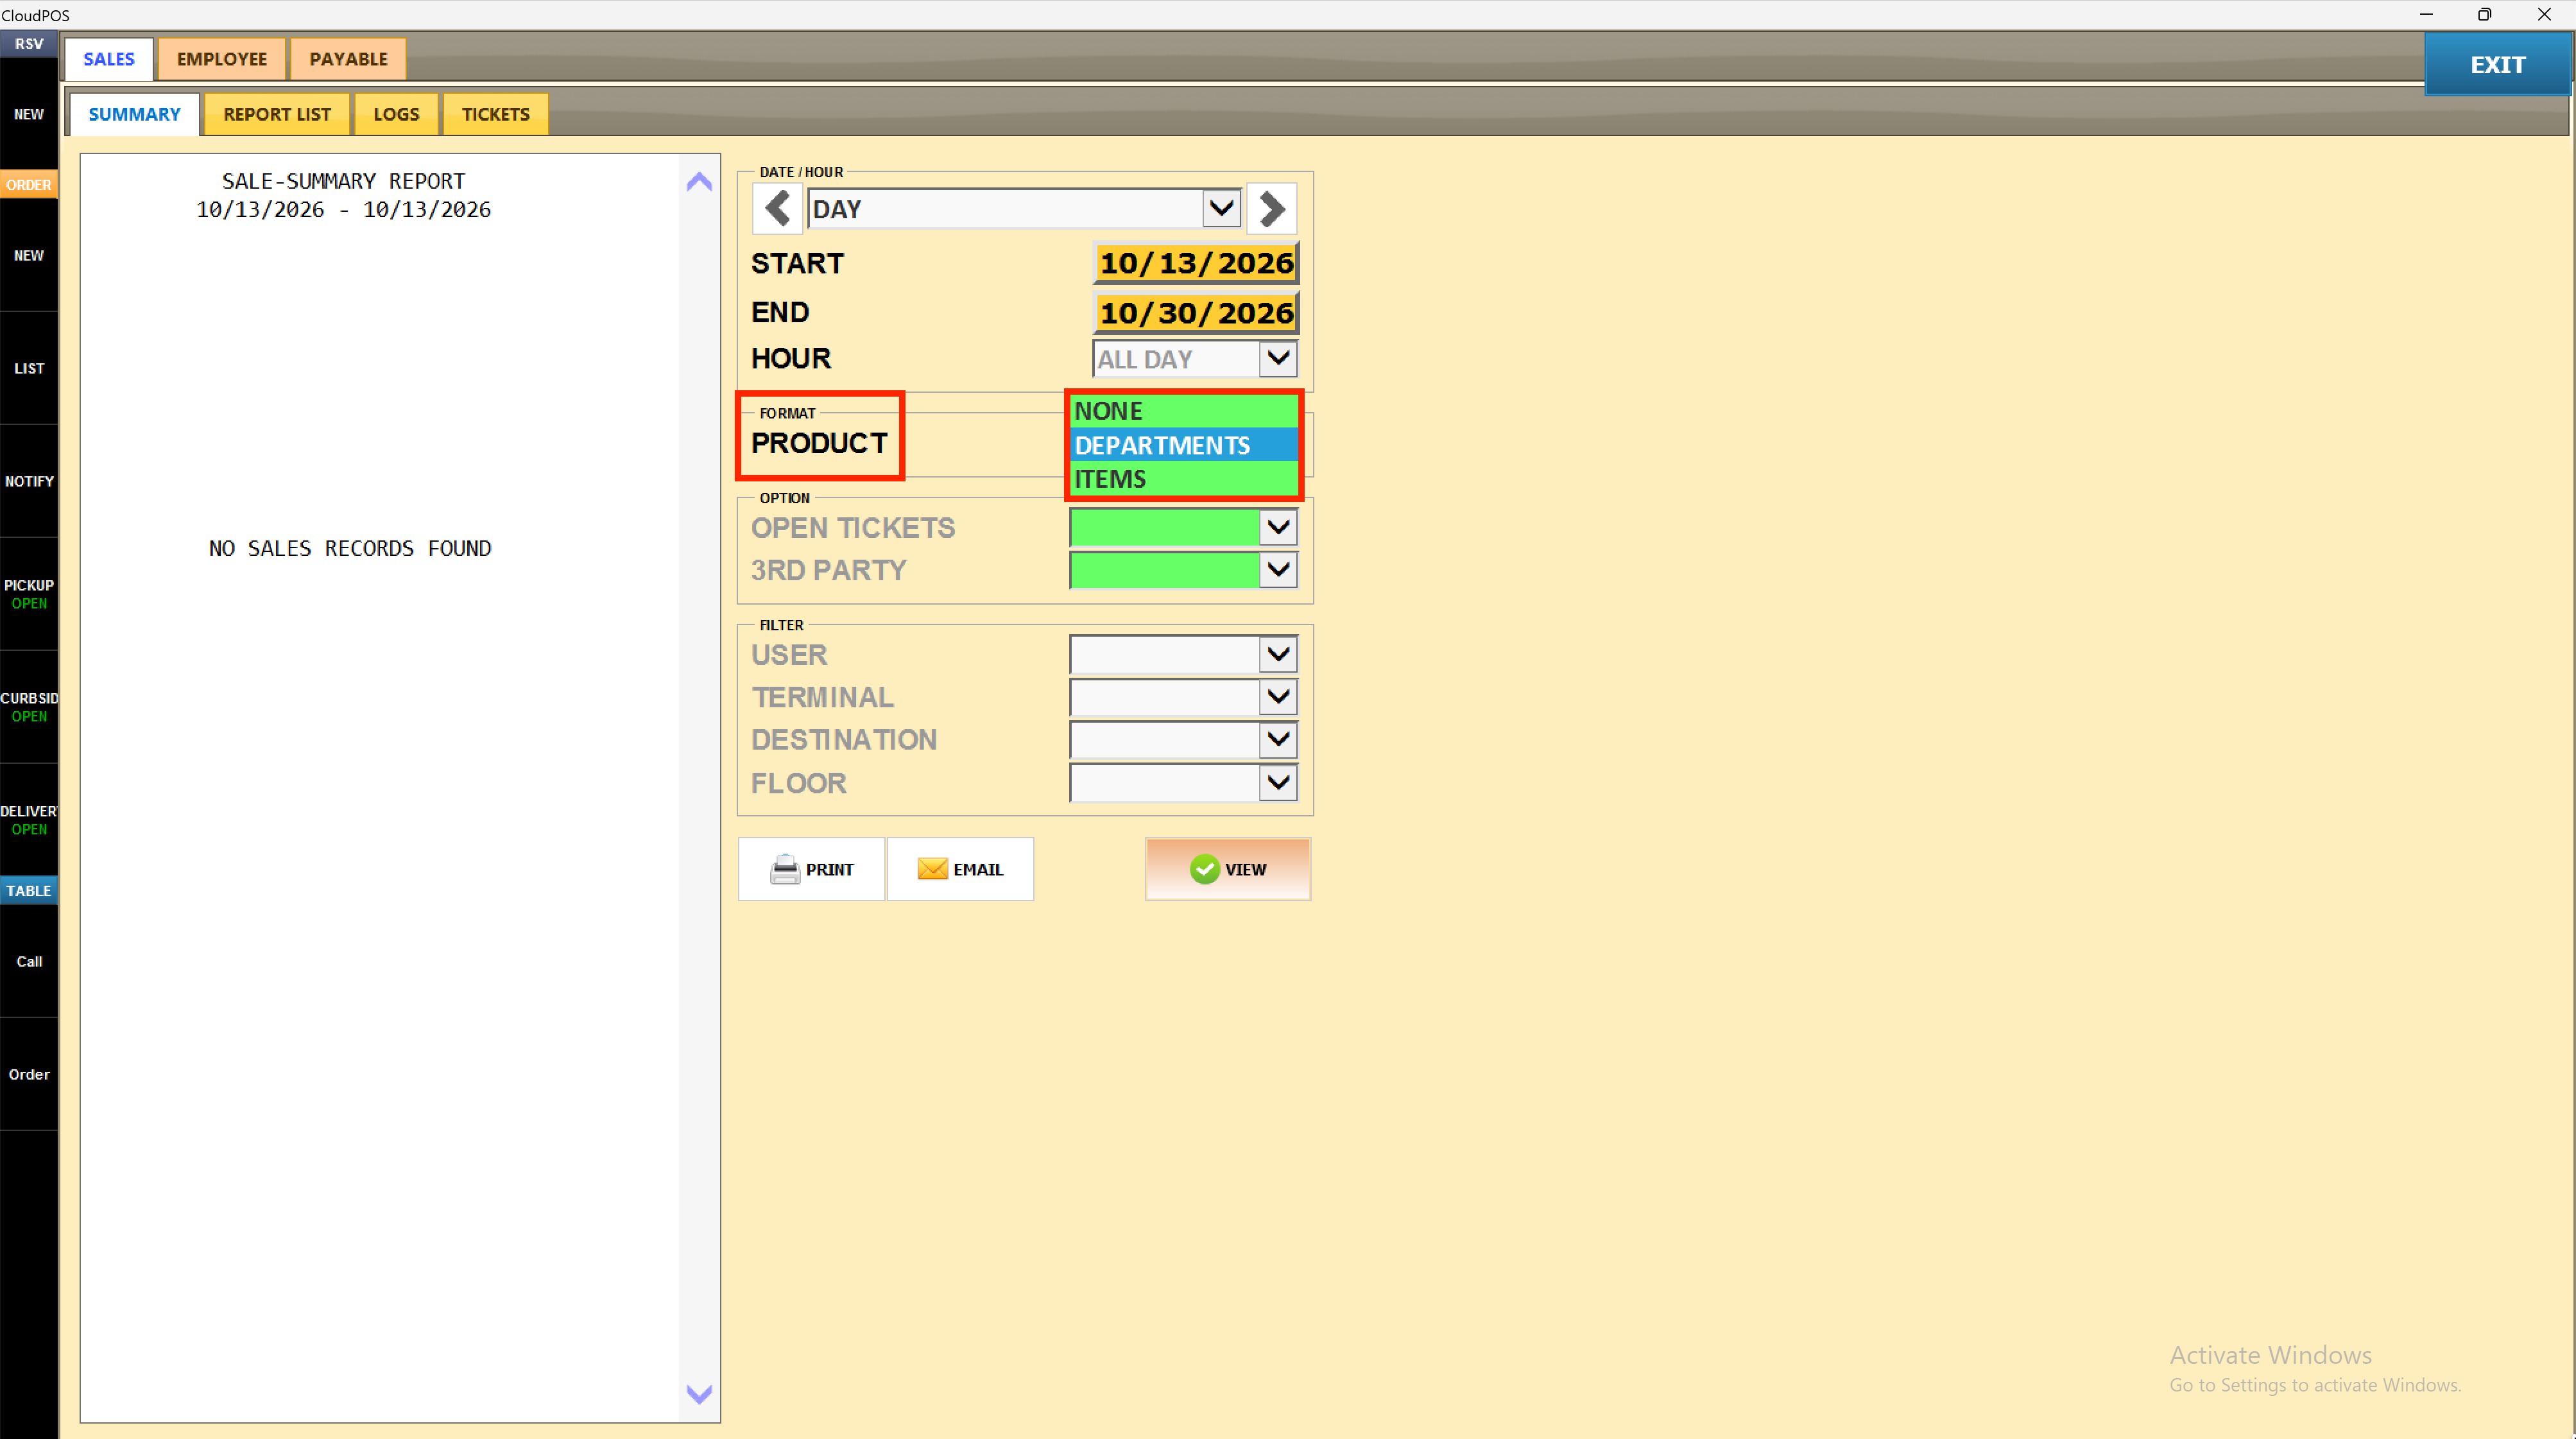
4. Set the Open Tickets Option
Select a value from the OPEN TICKETS dropdown under OPTION to include or exclude tickets that have not yet been closed.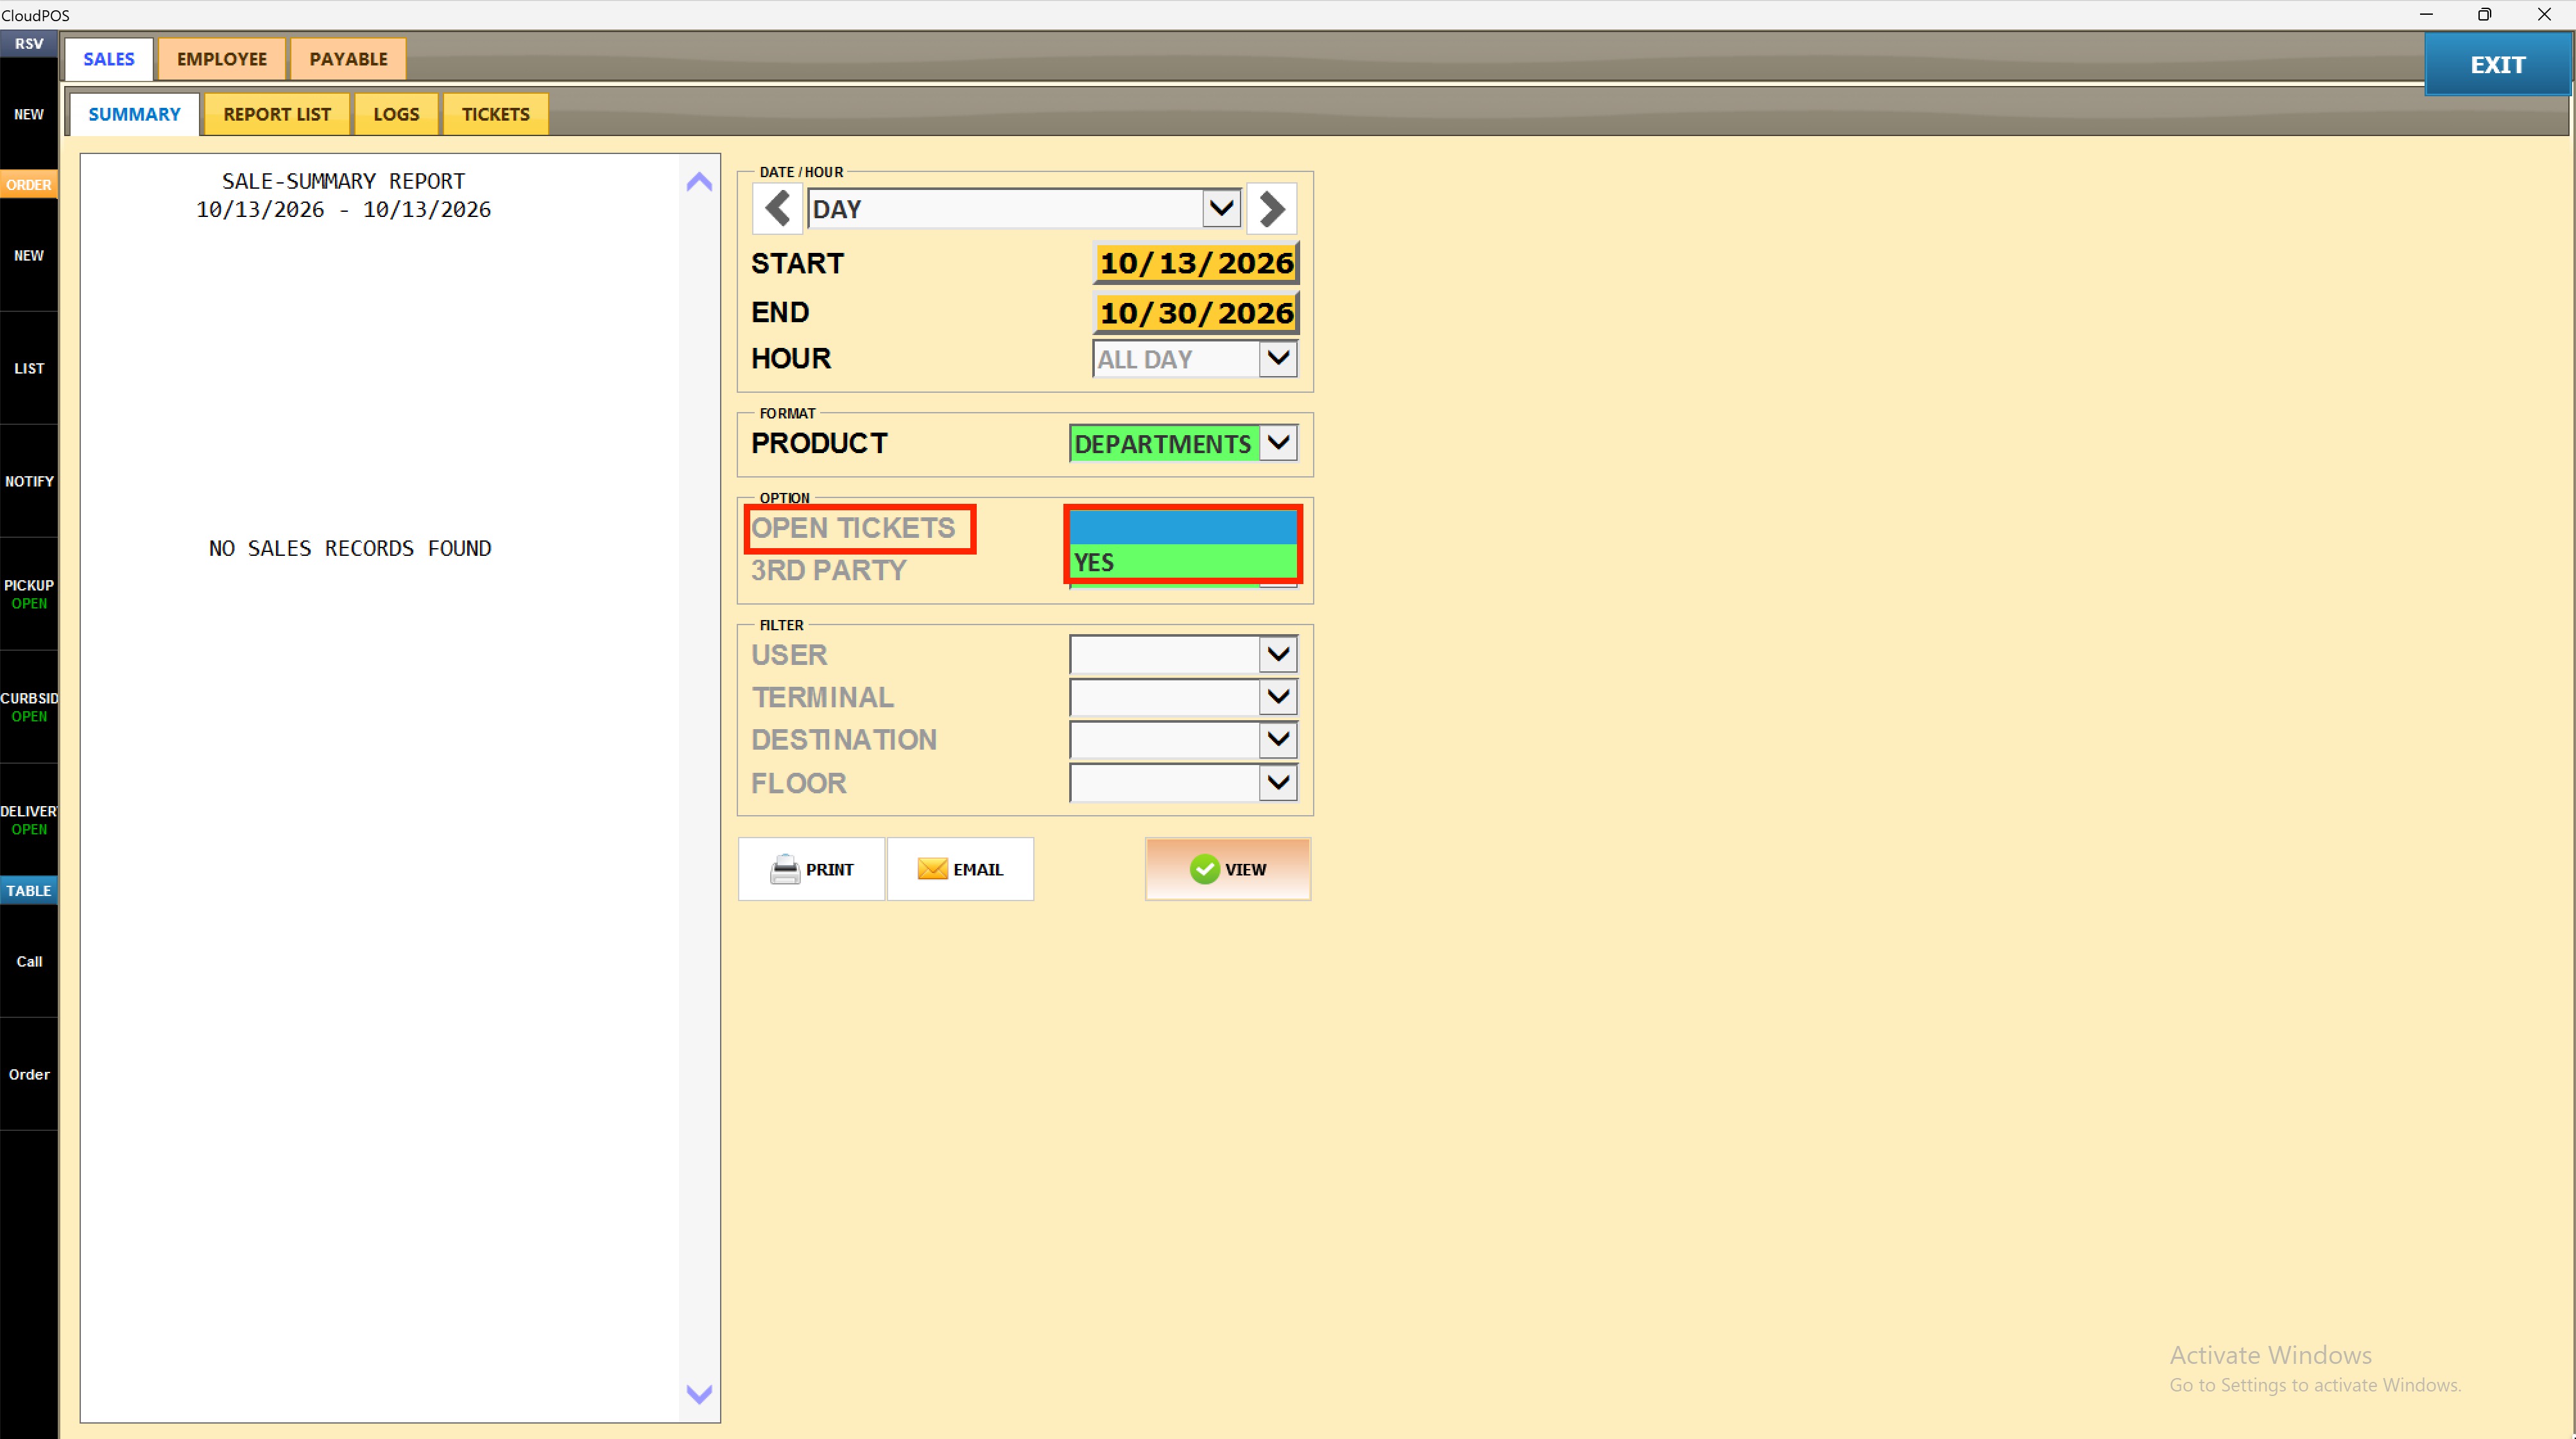
5. Set the 3rd Party Option
Select YES from the 3RD PARTY dropdown to include third-party orders in the report results.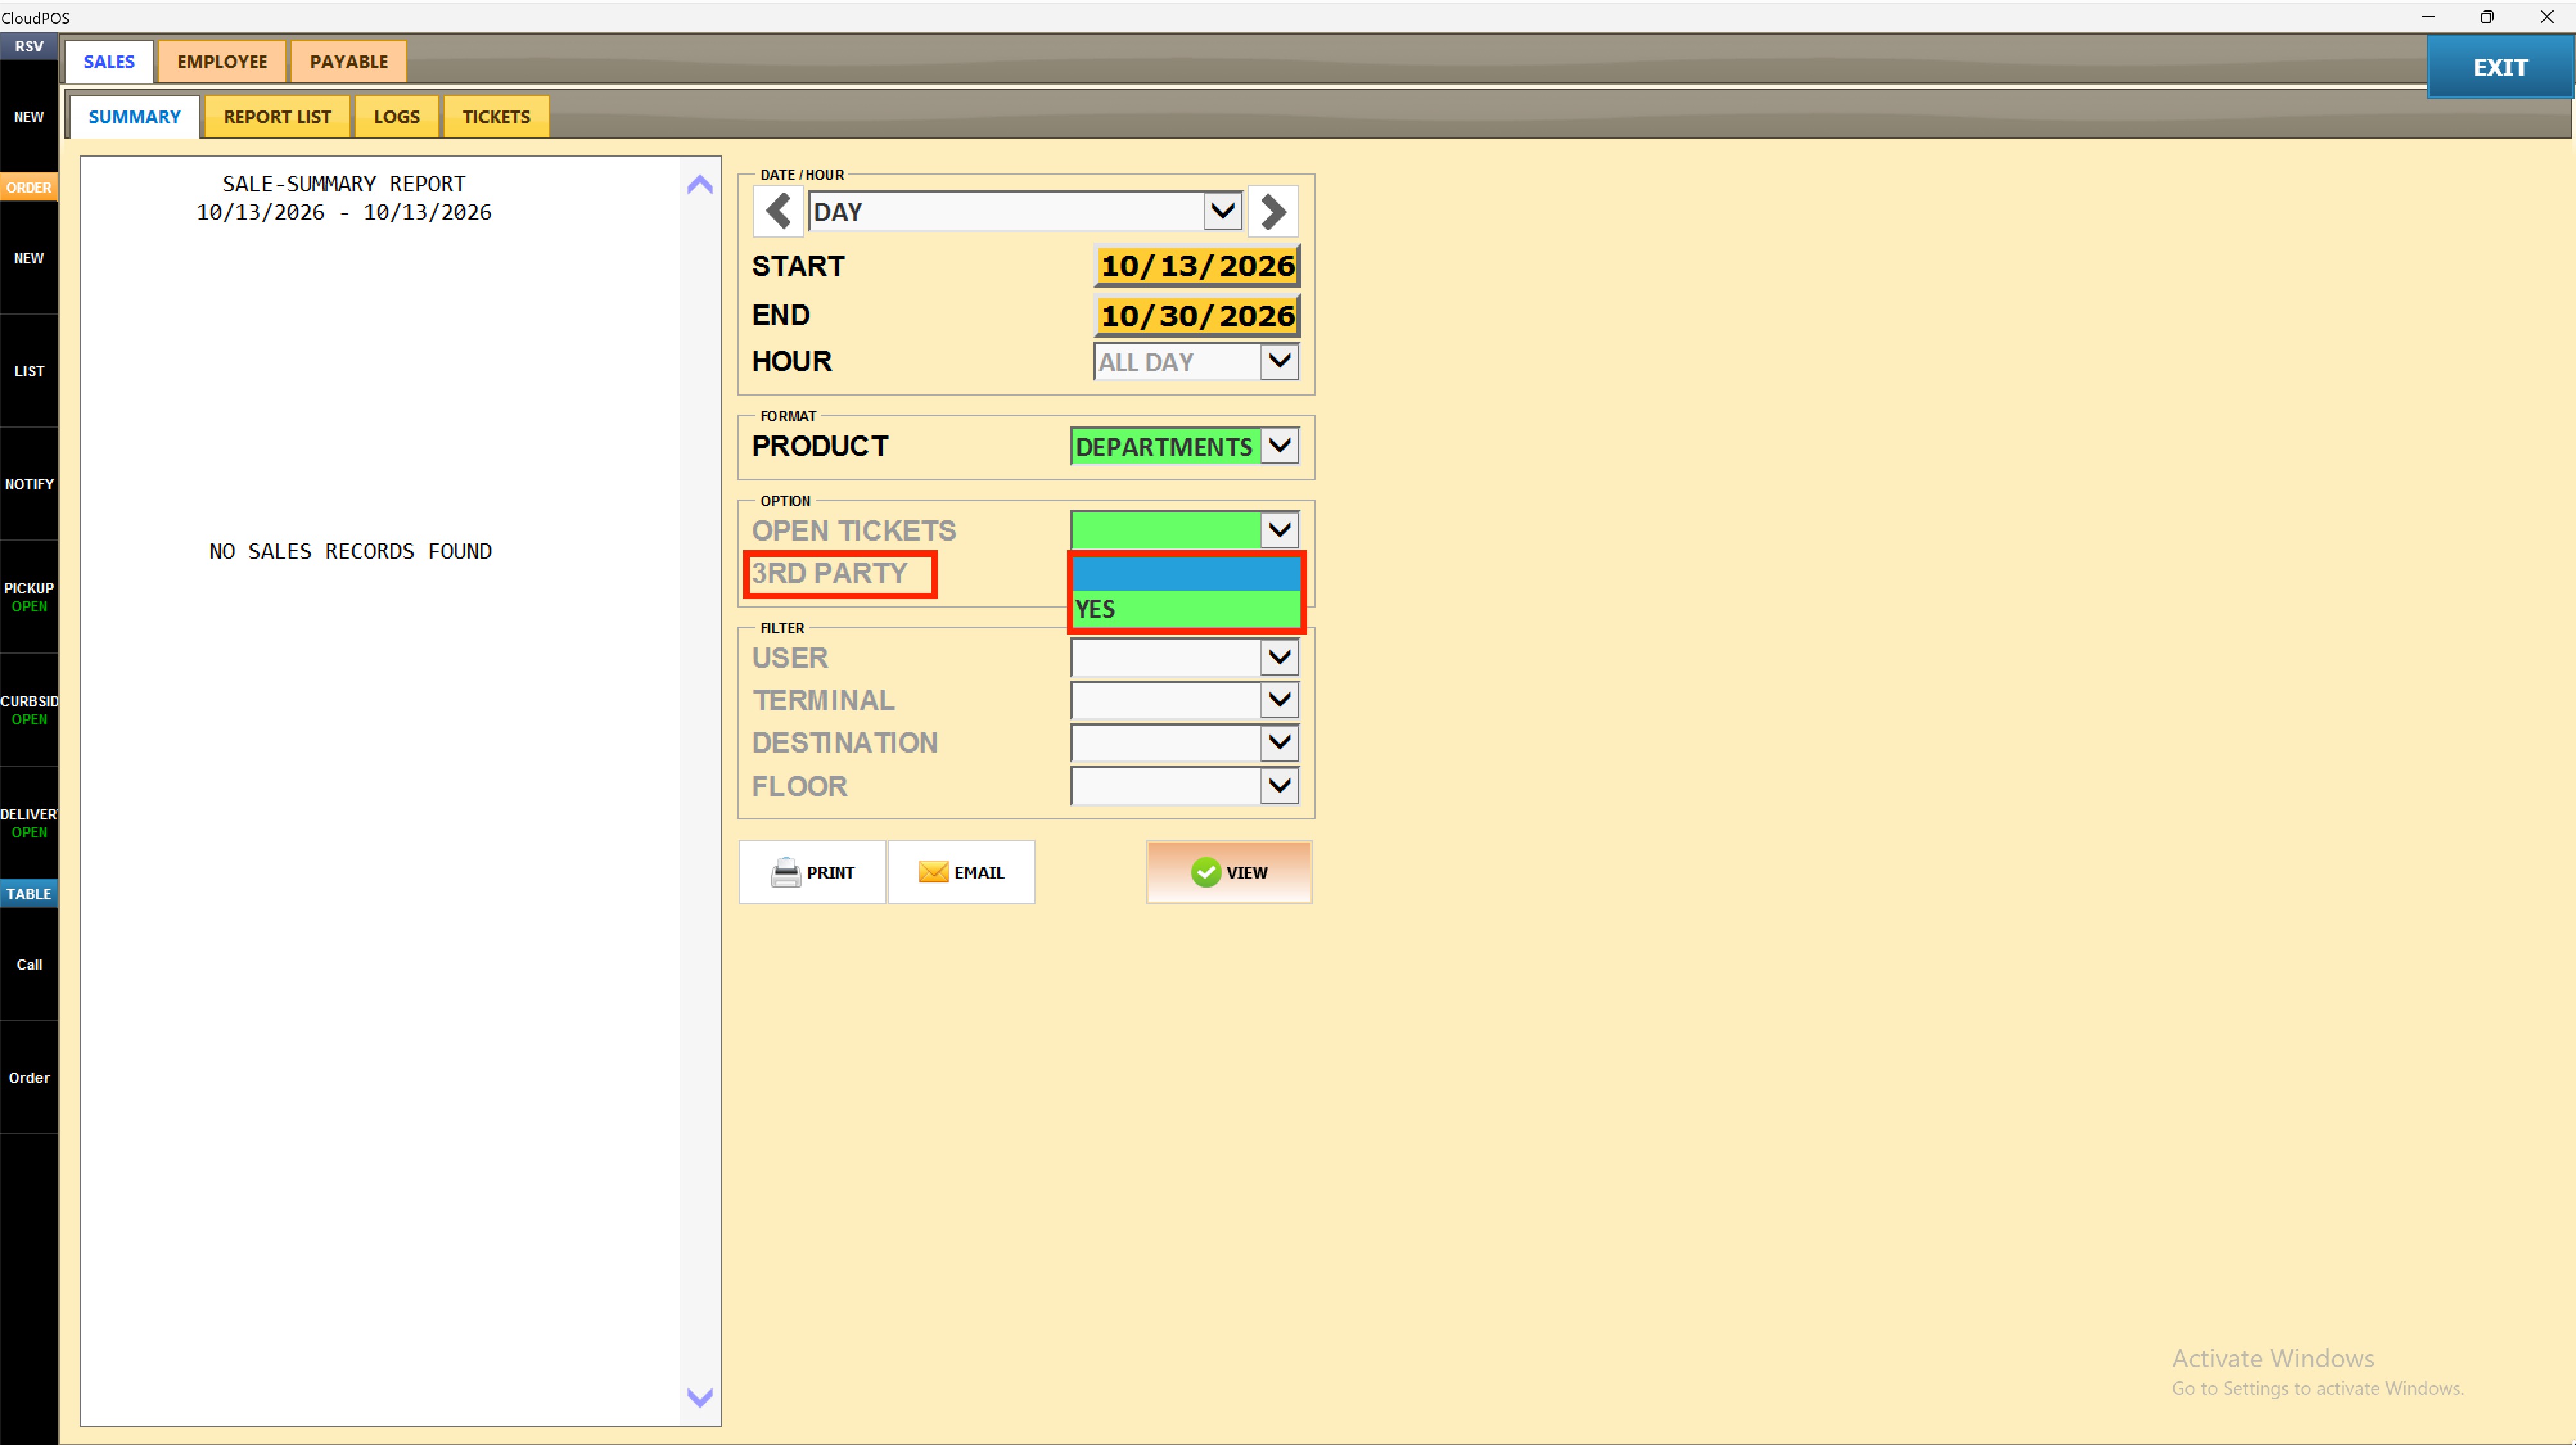
6. Apply the User Filter
Select a user from the USER dropdown under FILTER to limit the report to transactions processed by that employee. Leave blank to include all users.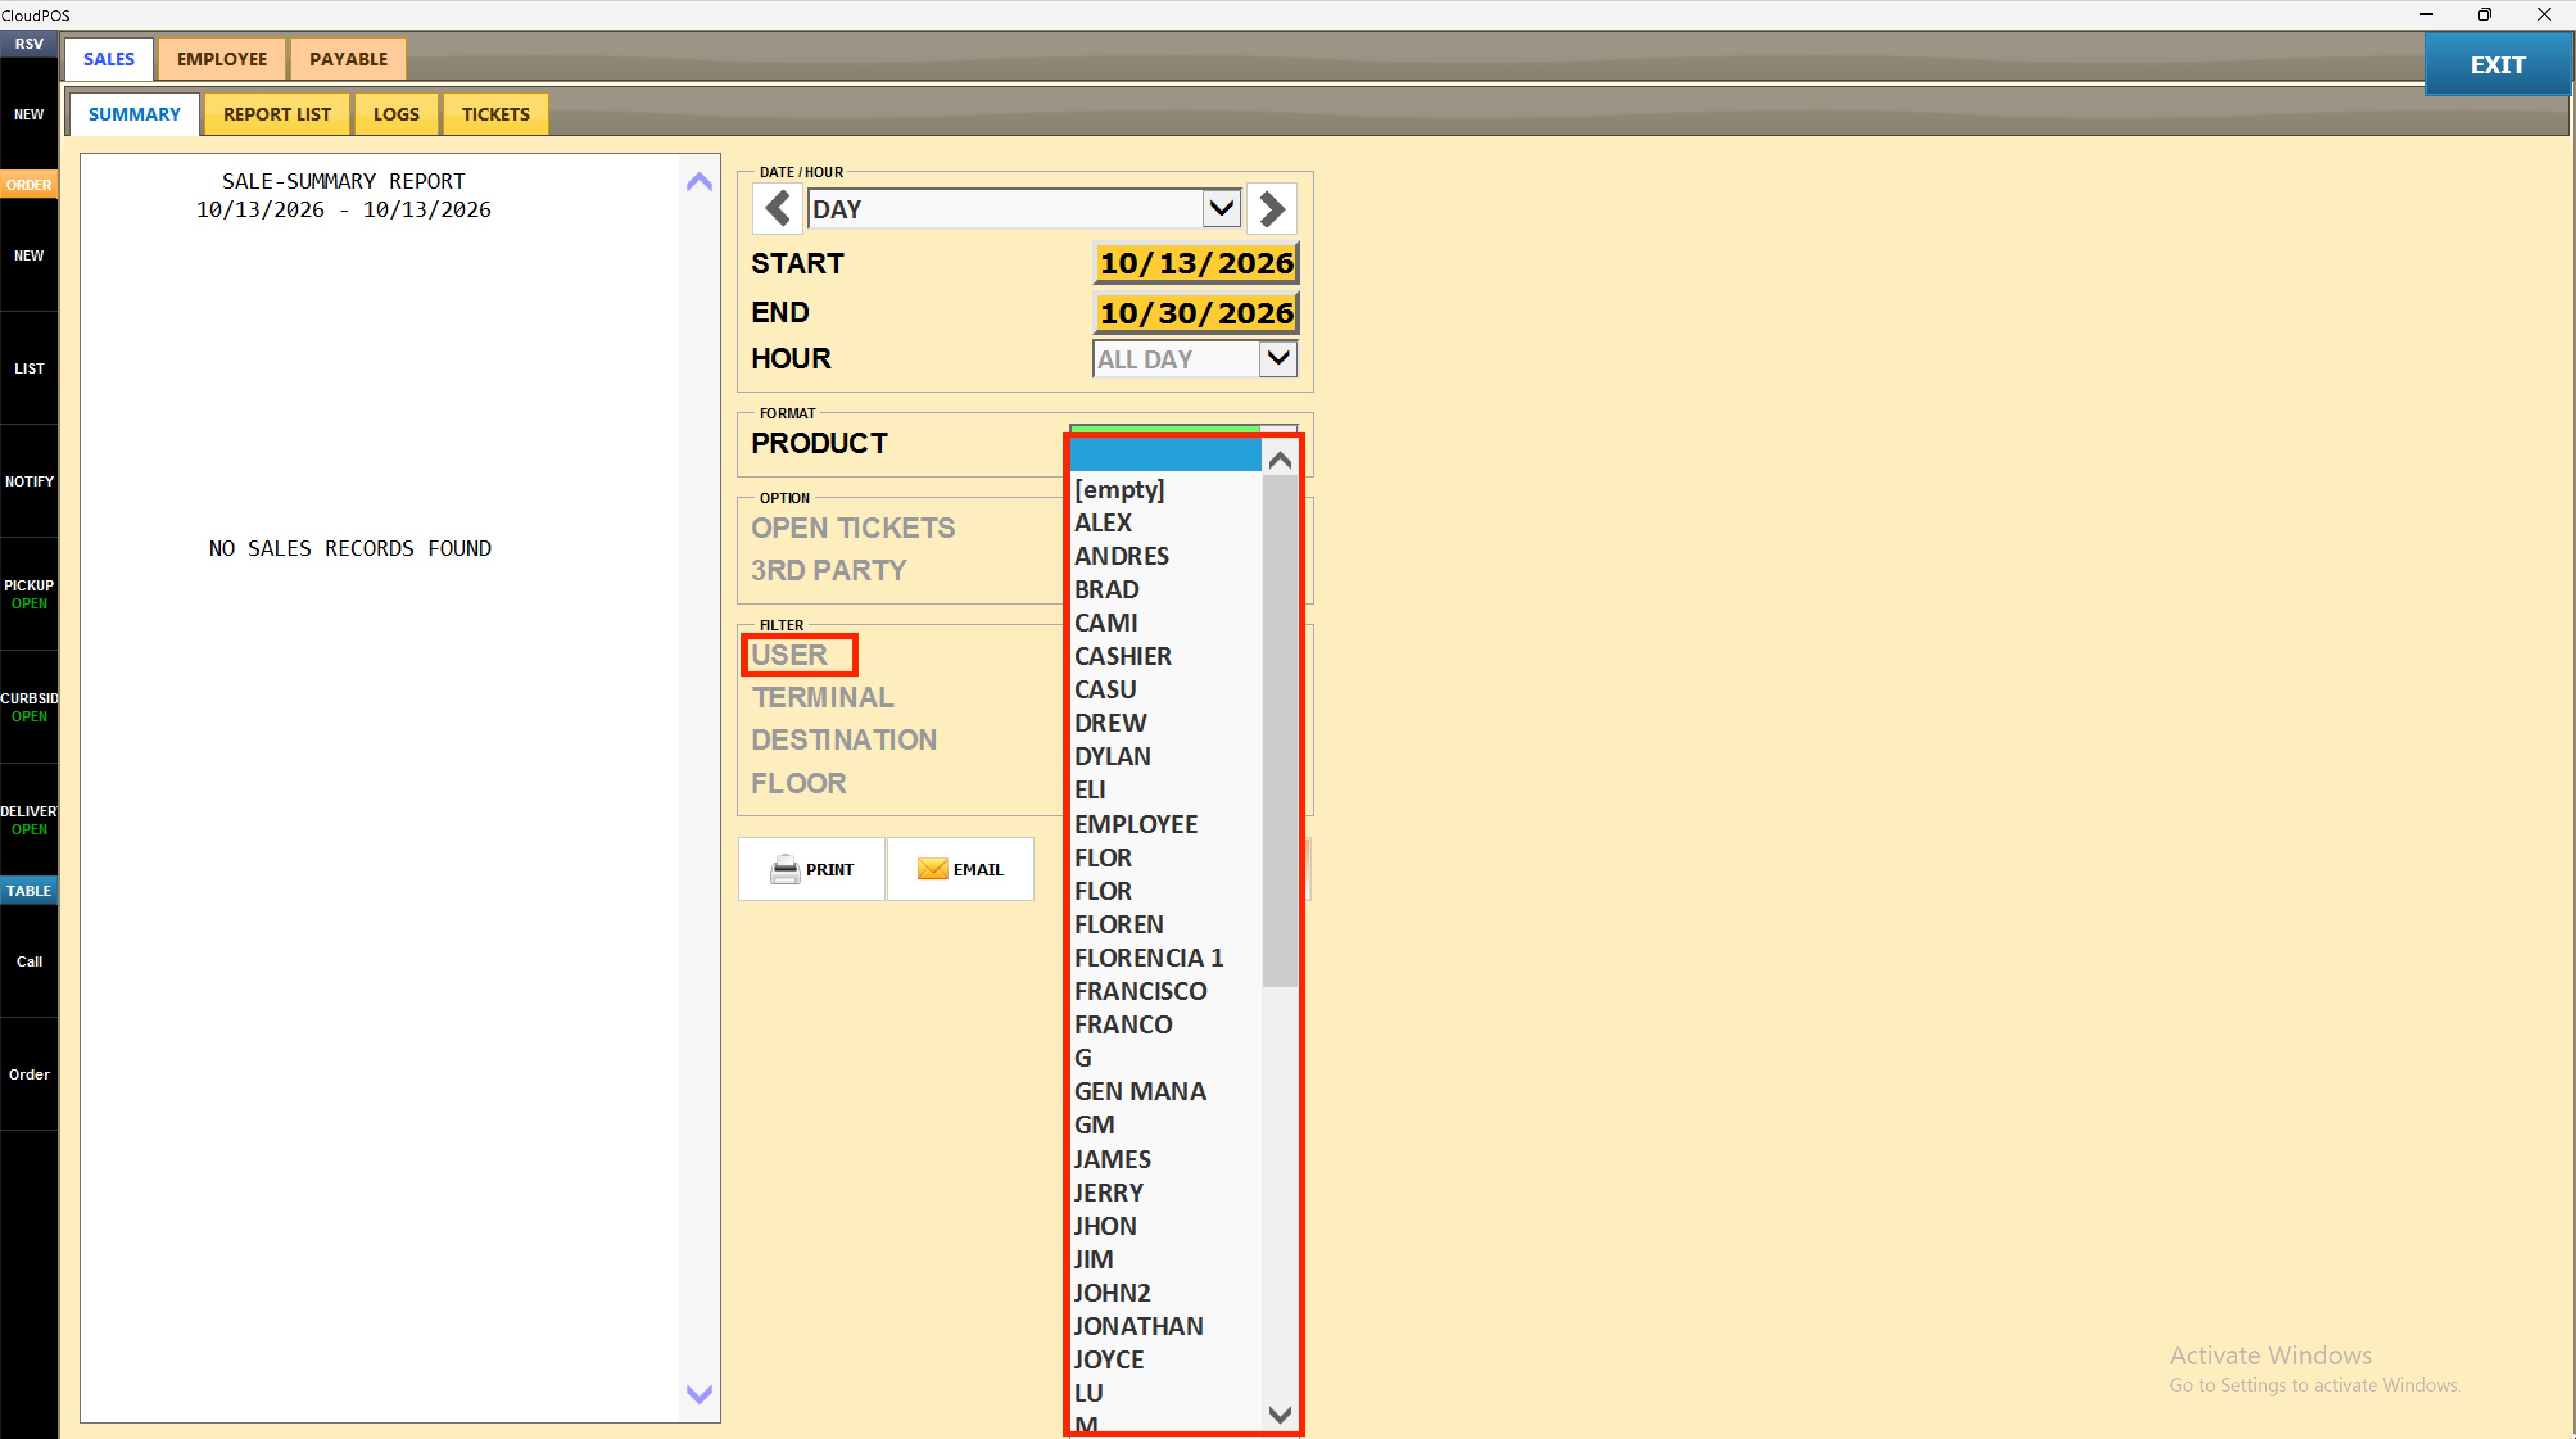
7. Apply the Terminal Filter
Select a terminal from the TERMINAL dropdown (POS1 through POS9) to limit the report to a specific station. Leave blank to include all terminals.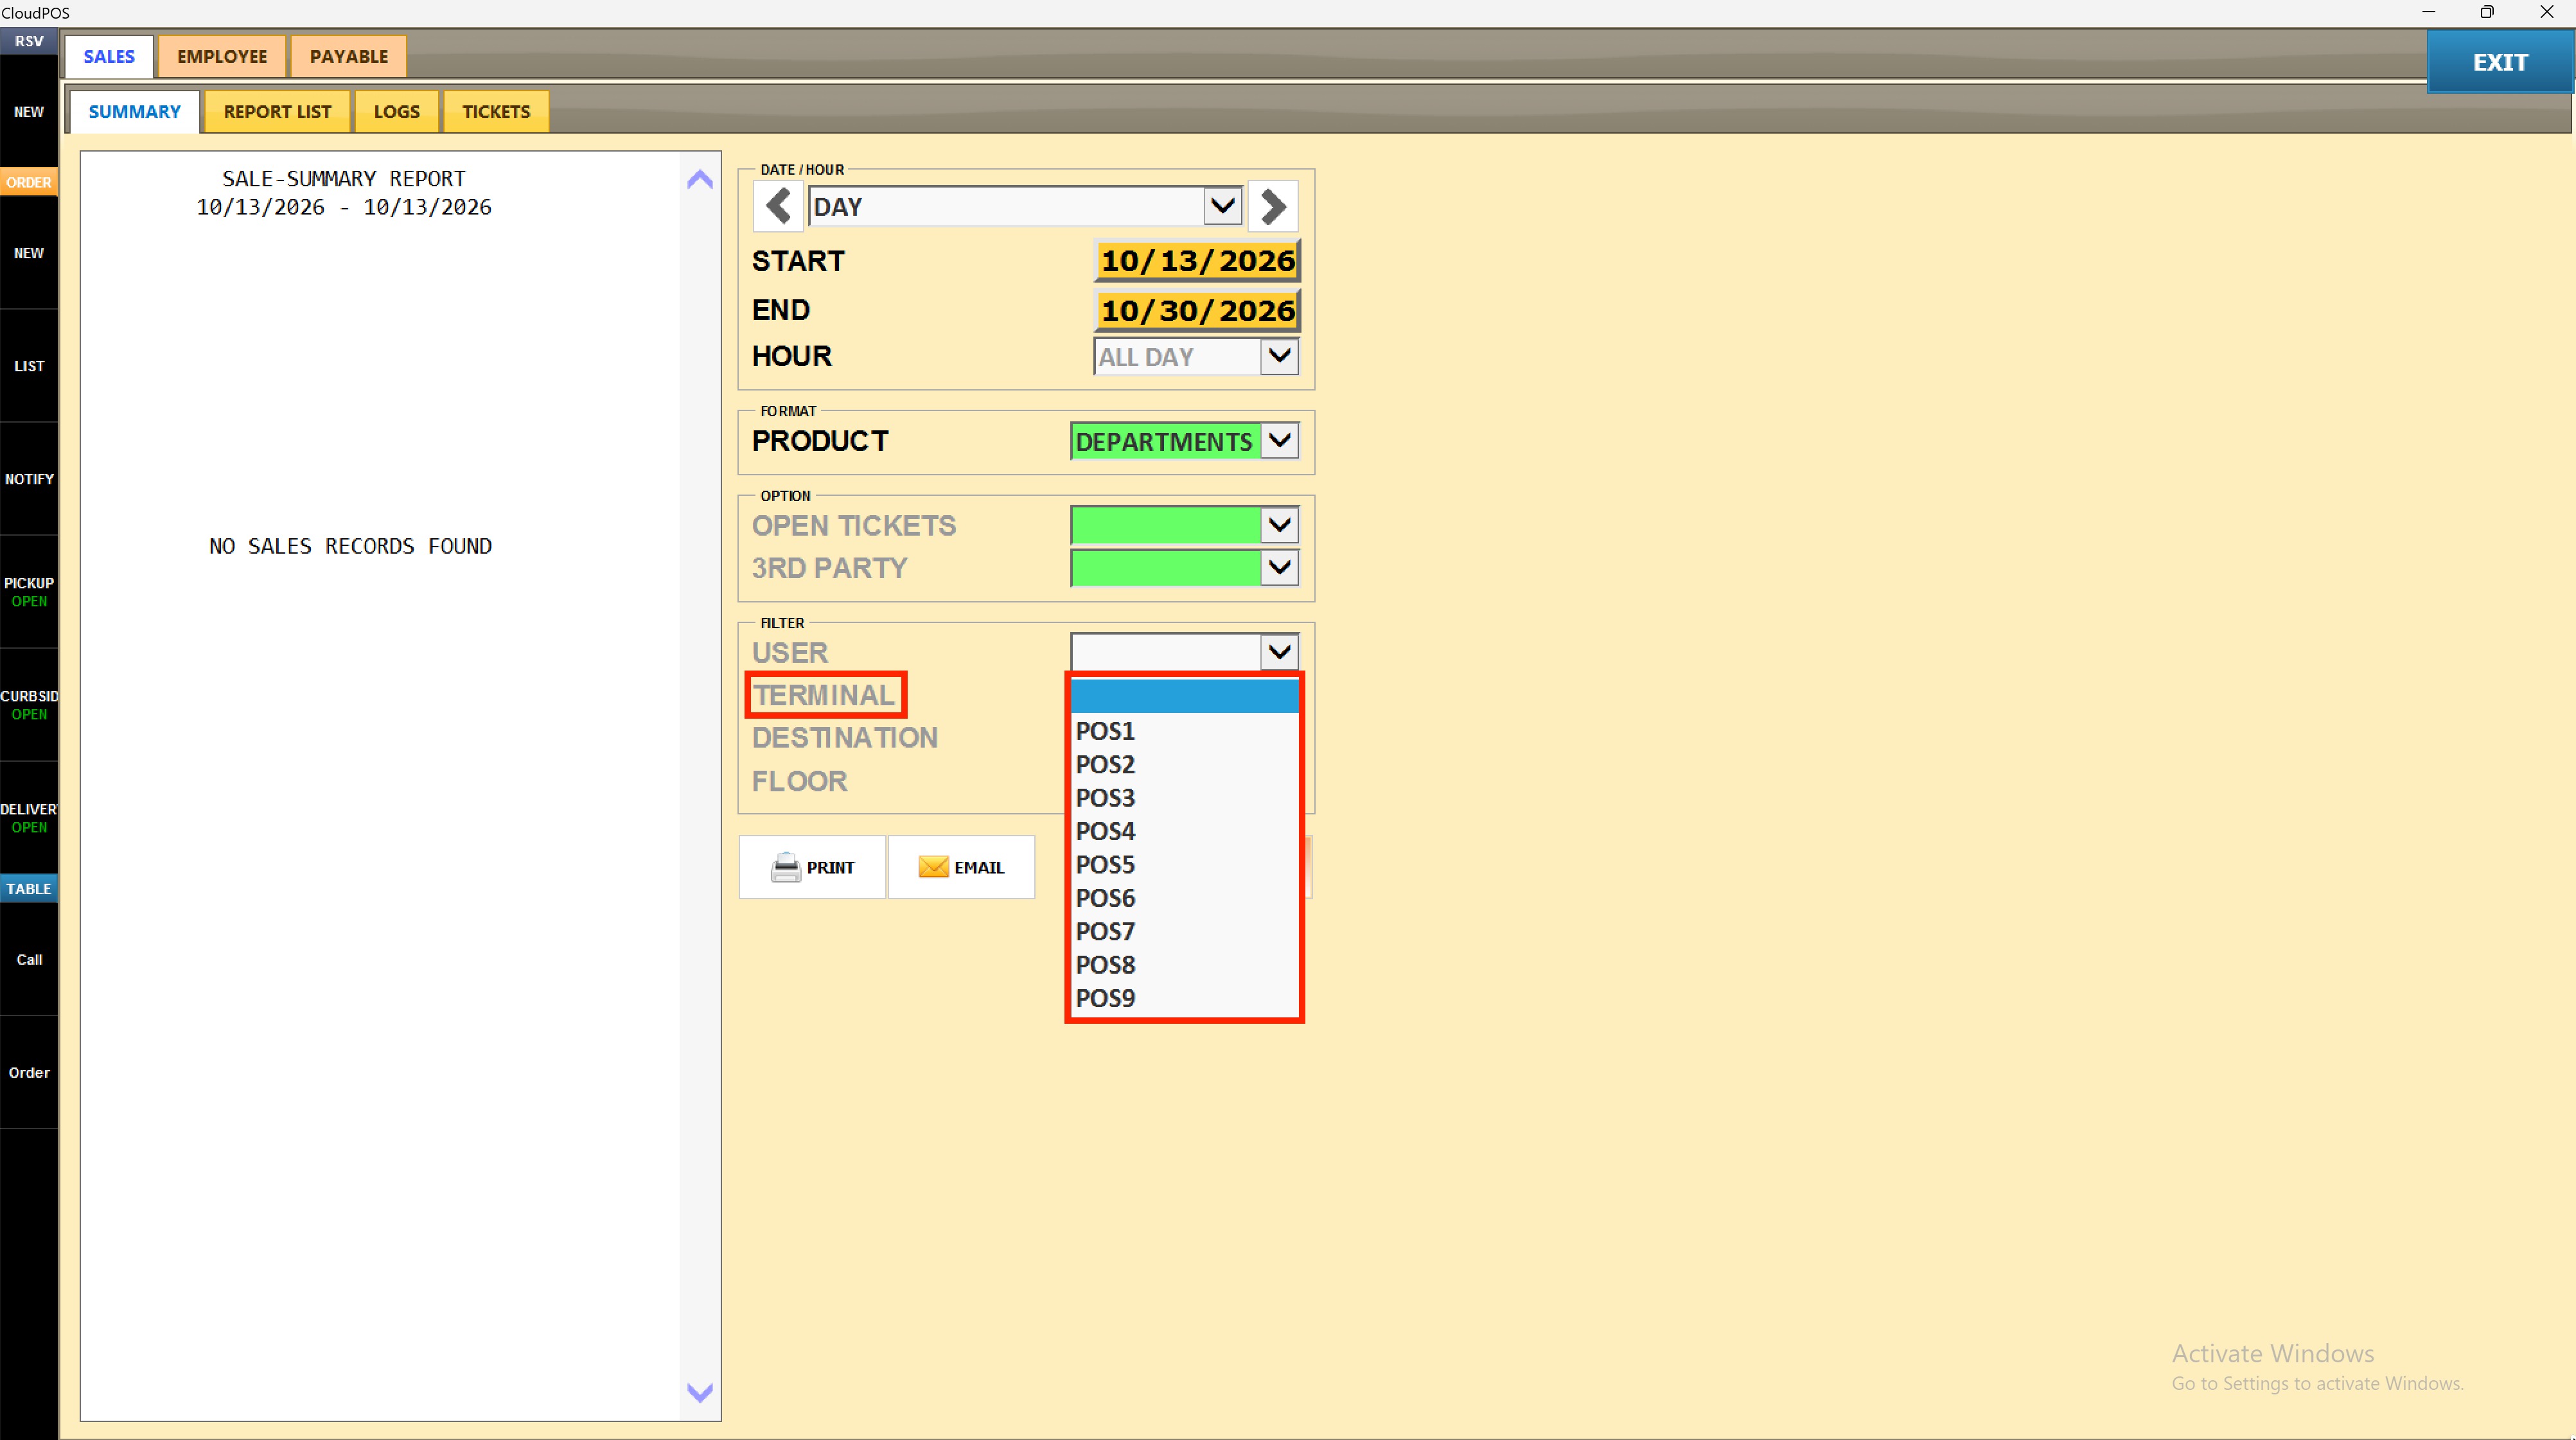
8. Apply the Destination Filter
Select a destination from the DESTINATION dropdown to limit results to a specific order type, such as TAKE-OUT, DINE-IN, CALL-IN, DELIVERY, DRIVE-THRU, CATERING, SELF-SERVE, or BAR. Leave blank to include all destinations.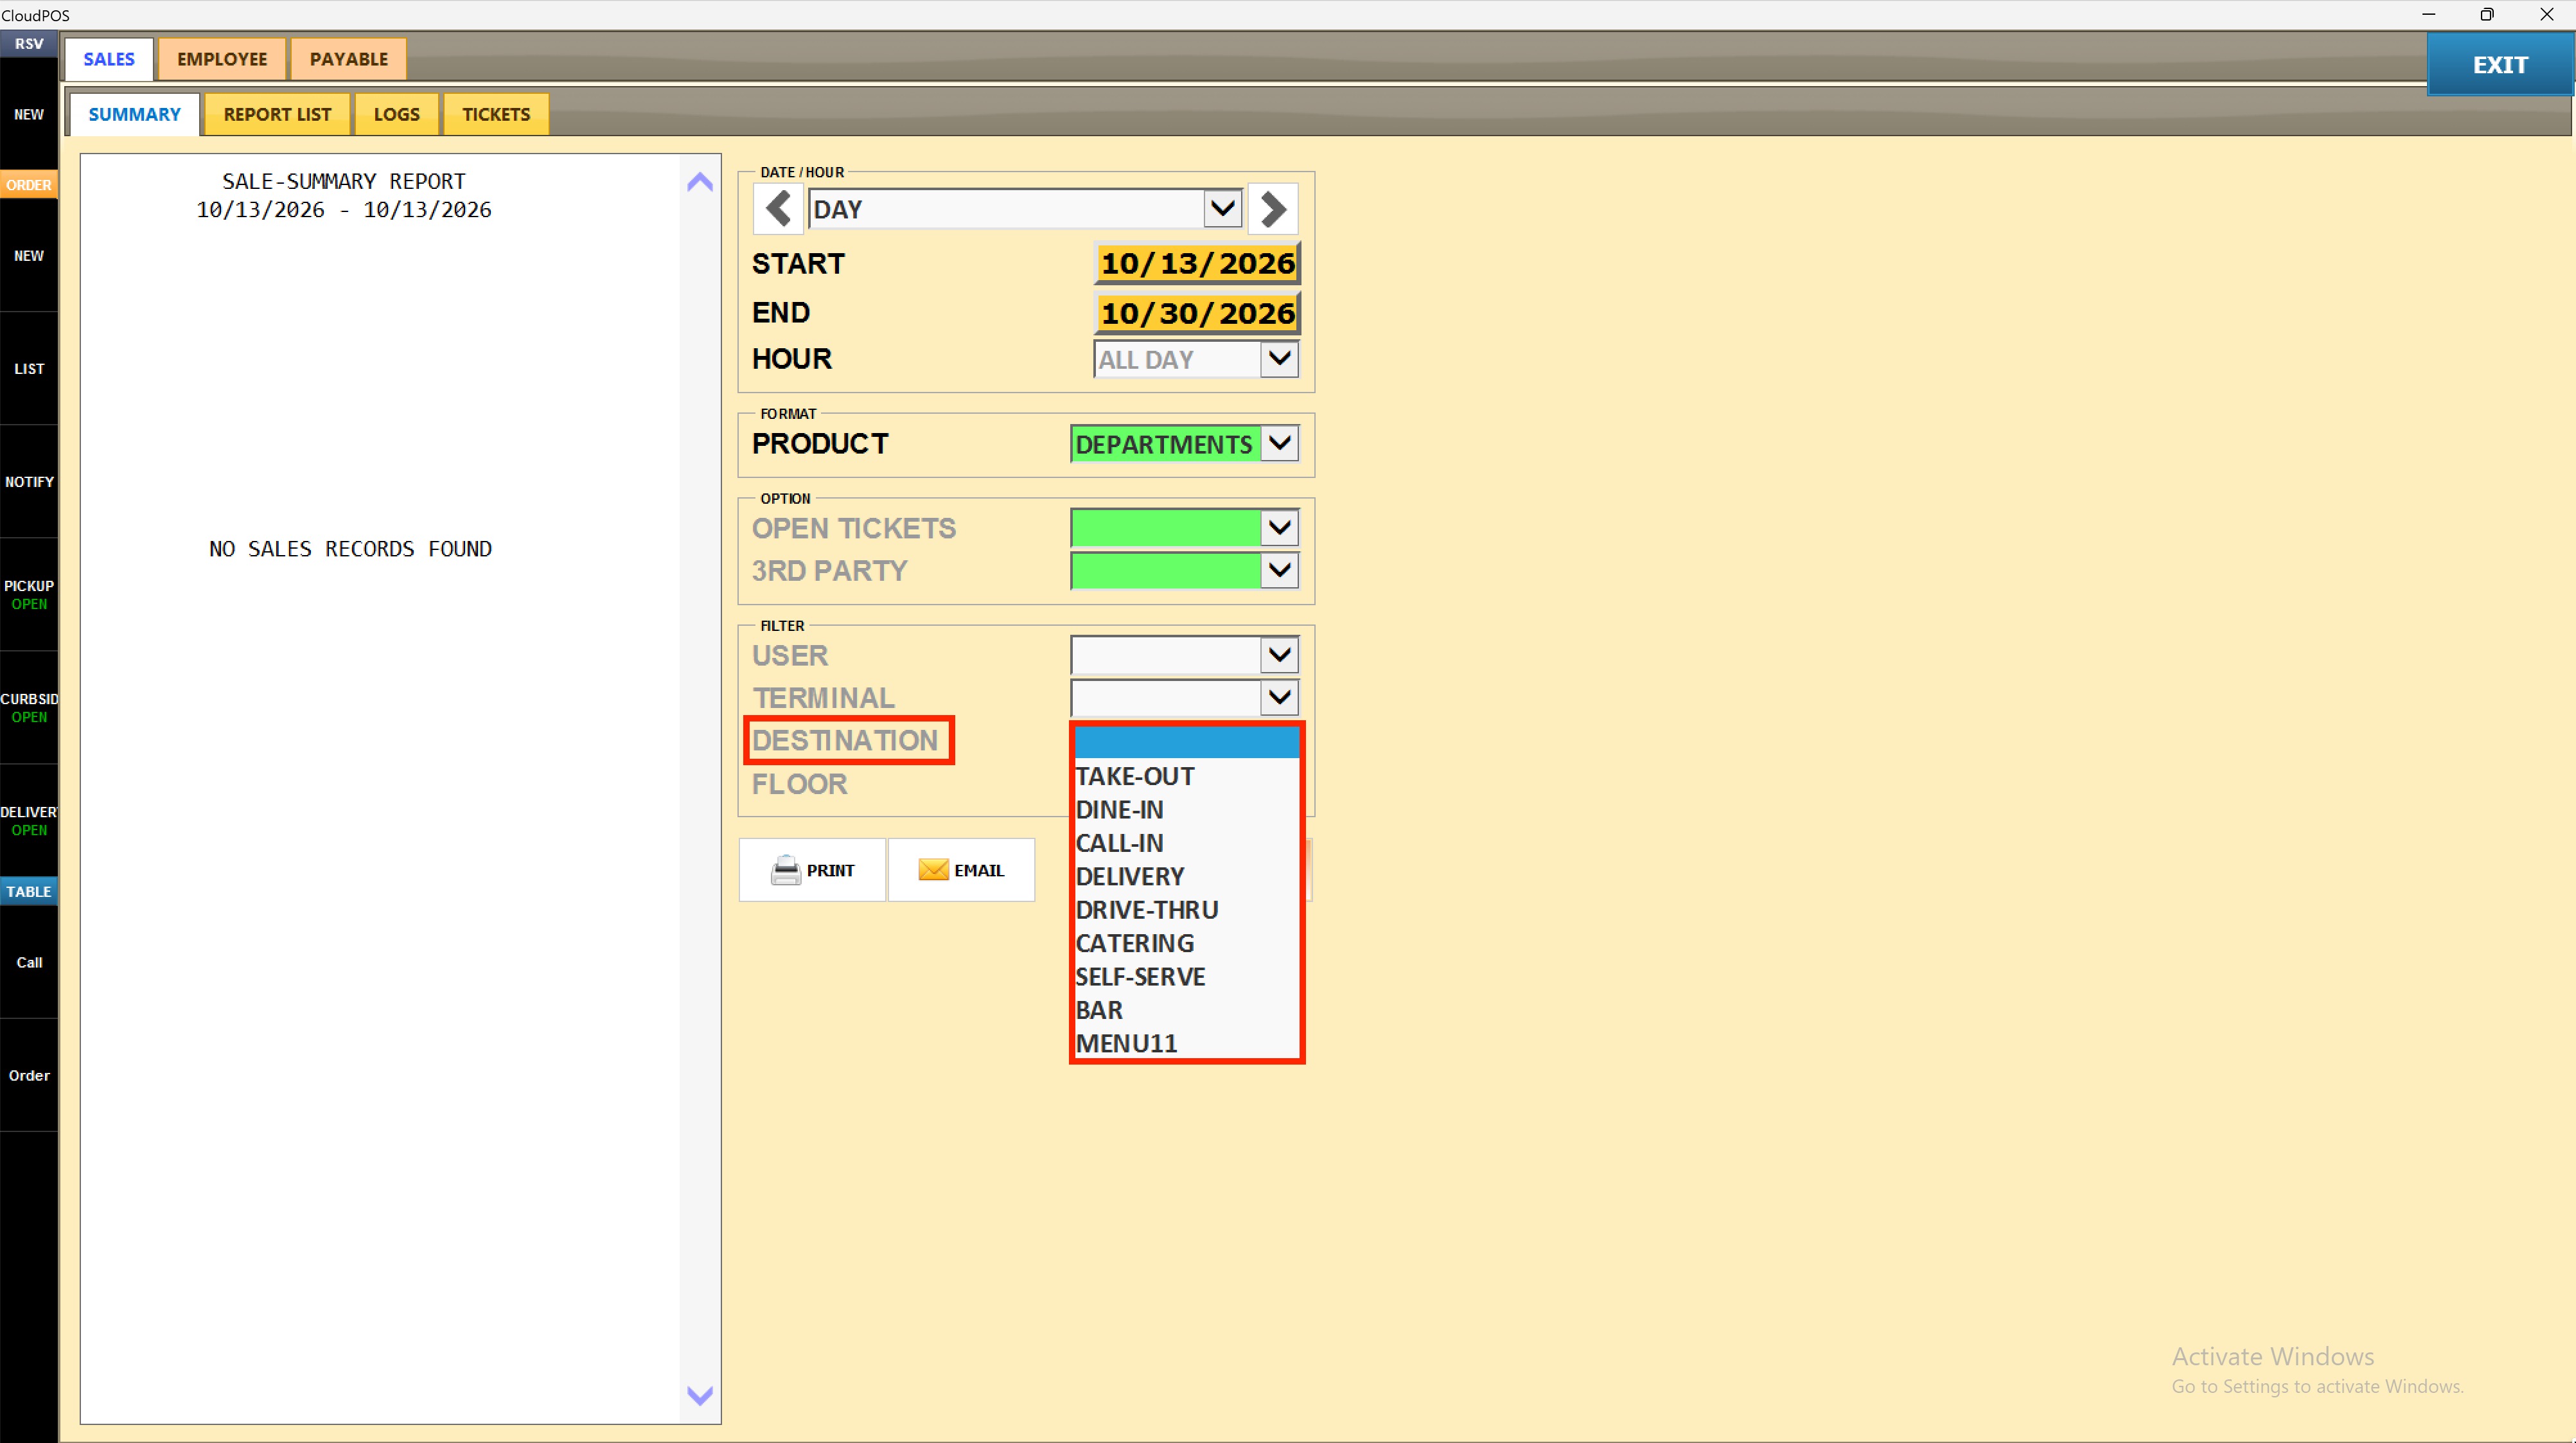
9. Apply the Floor Filter
Select a floor from the FLOOR dropdown to limit results to a specific dining area, such as TAKE-OUT, BAR, F: FIRST FLOOR, or F: SECOND FLOOR. Leave blank to include all floors.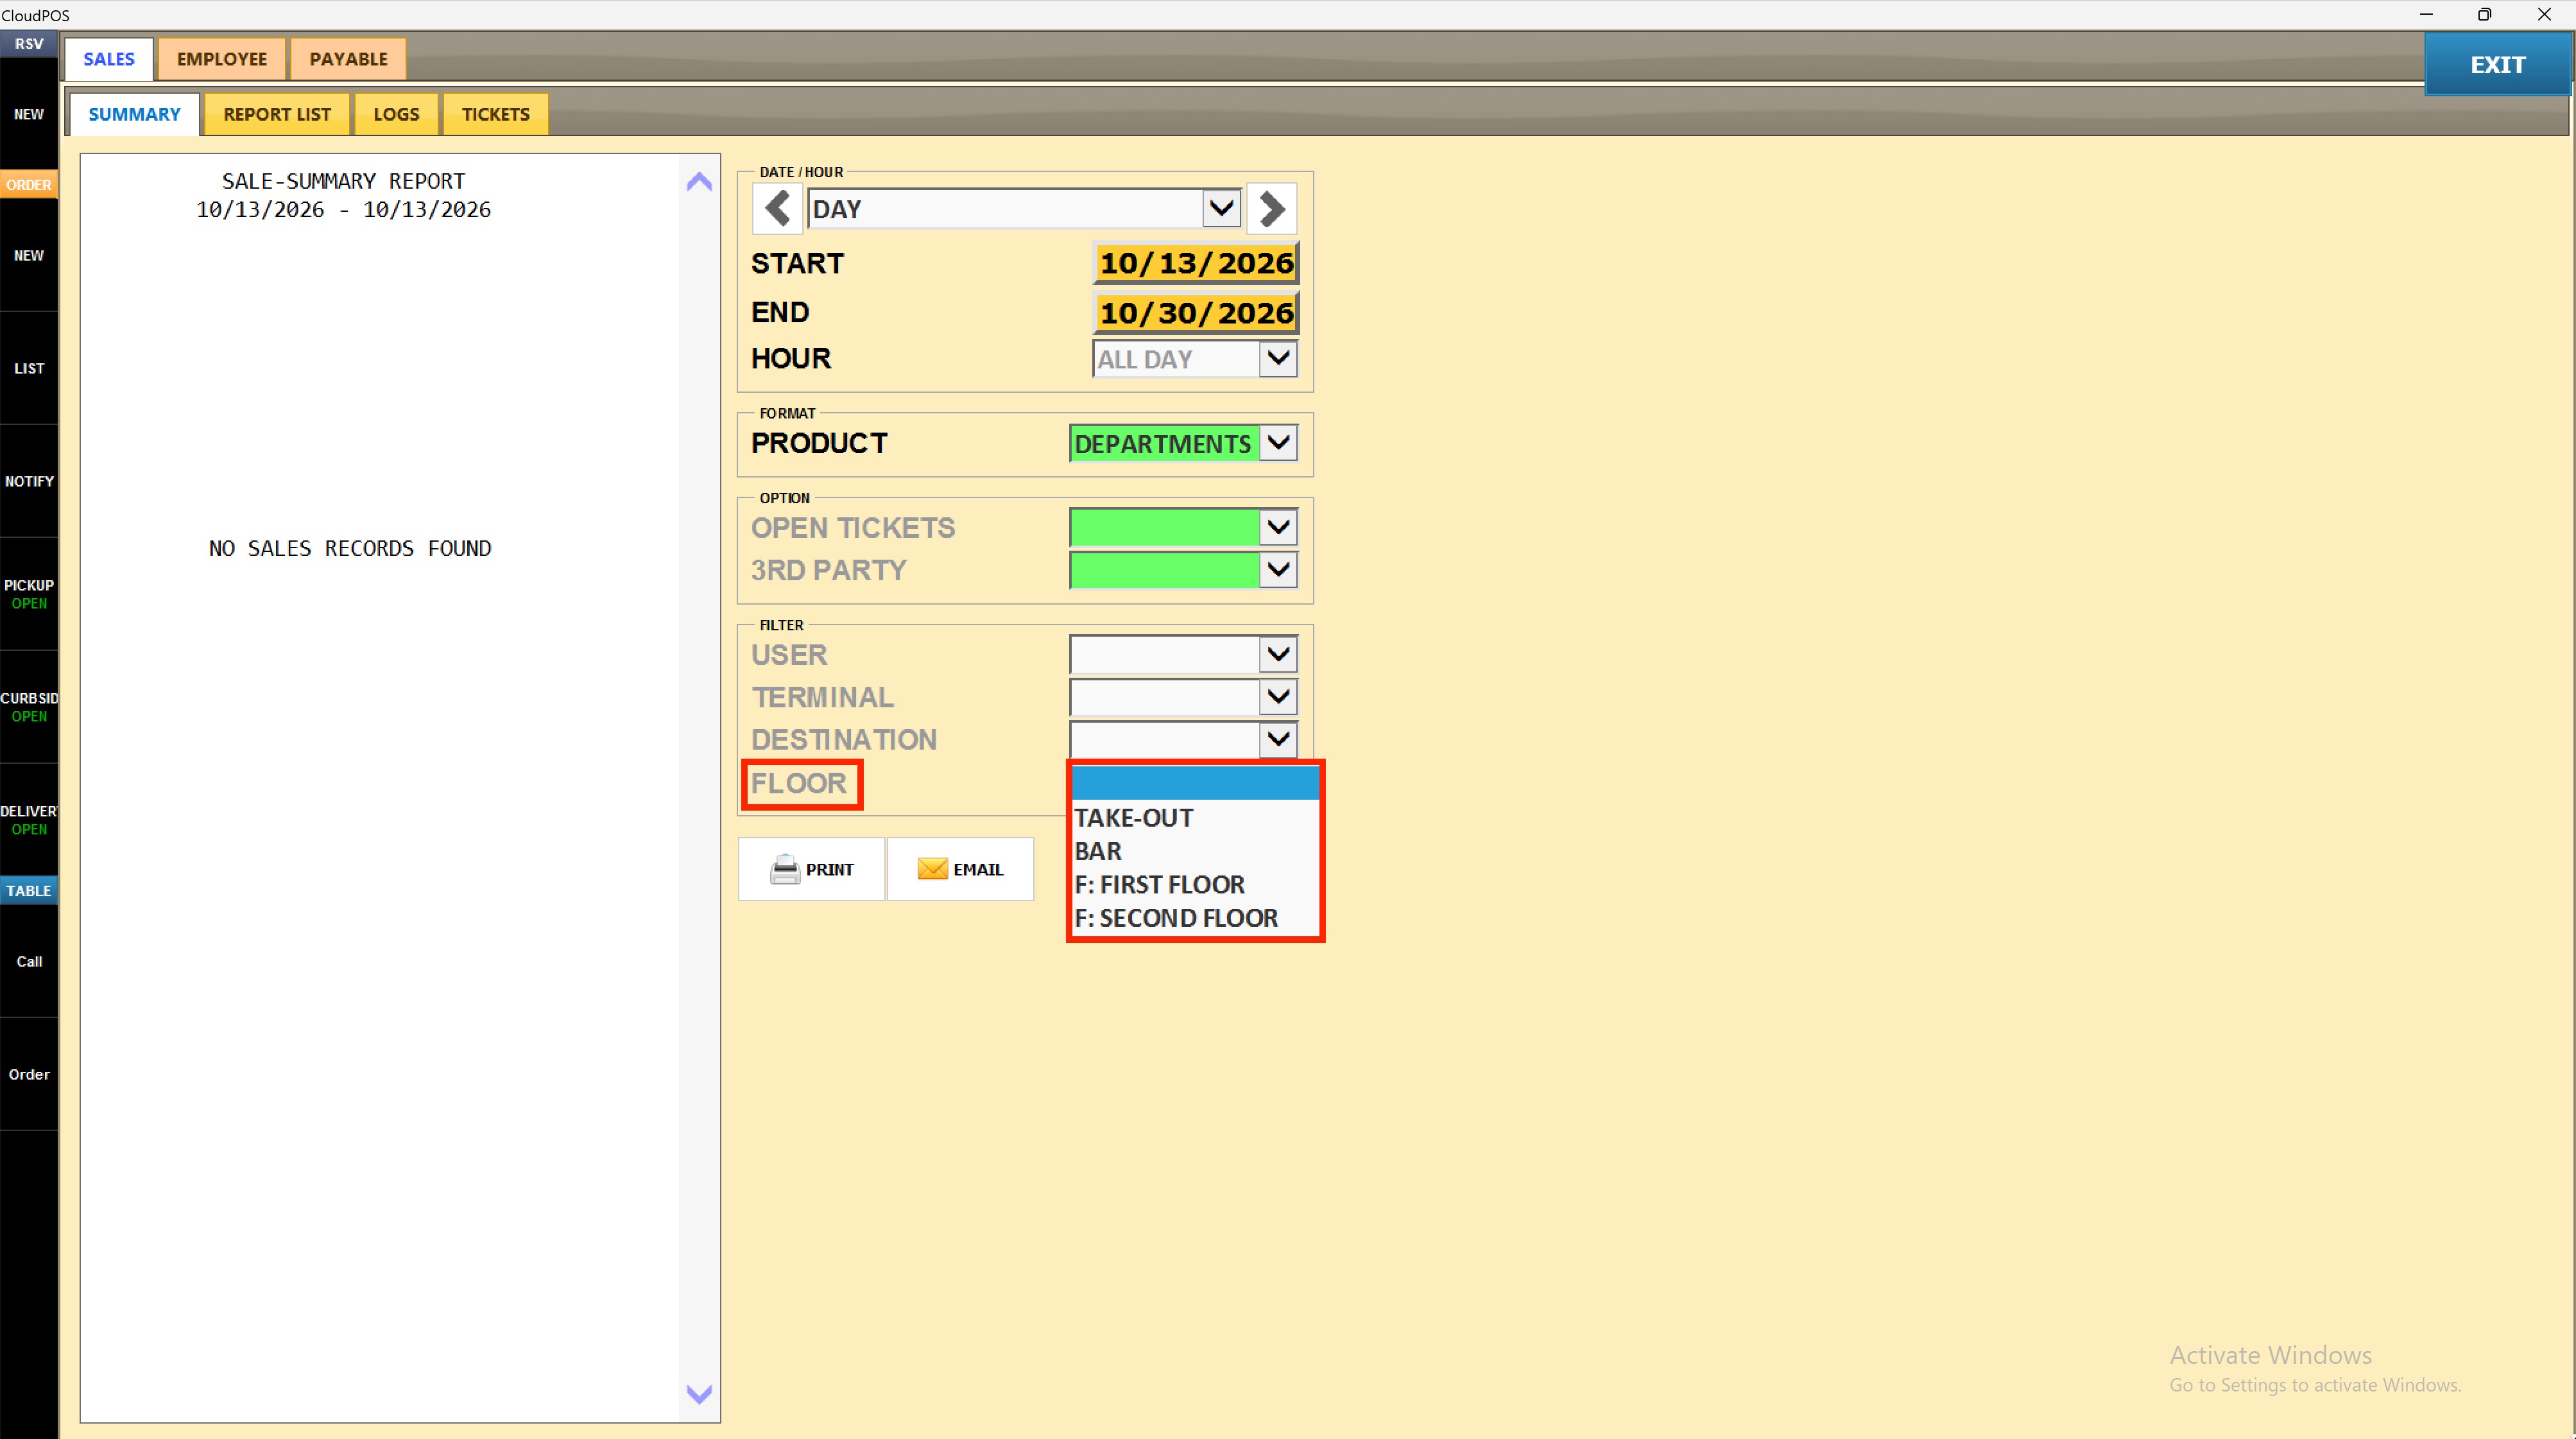
10. Generate the Report
Press VIEW to refresh the report preview on the left with the selected filters applied. Press PRINT to send the report to the printer, or press EMAIL to send it by email.
PRINT
Press PRINT to print the report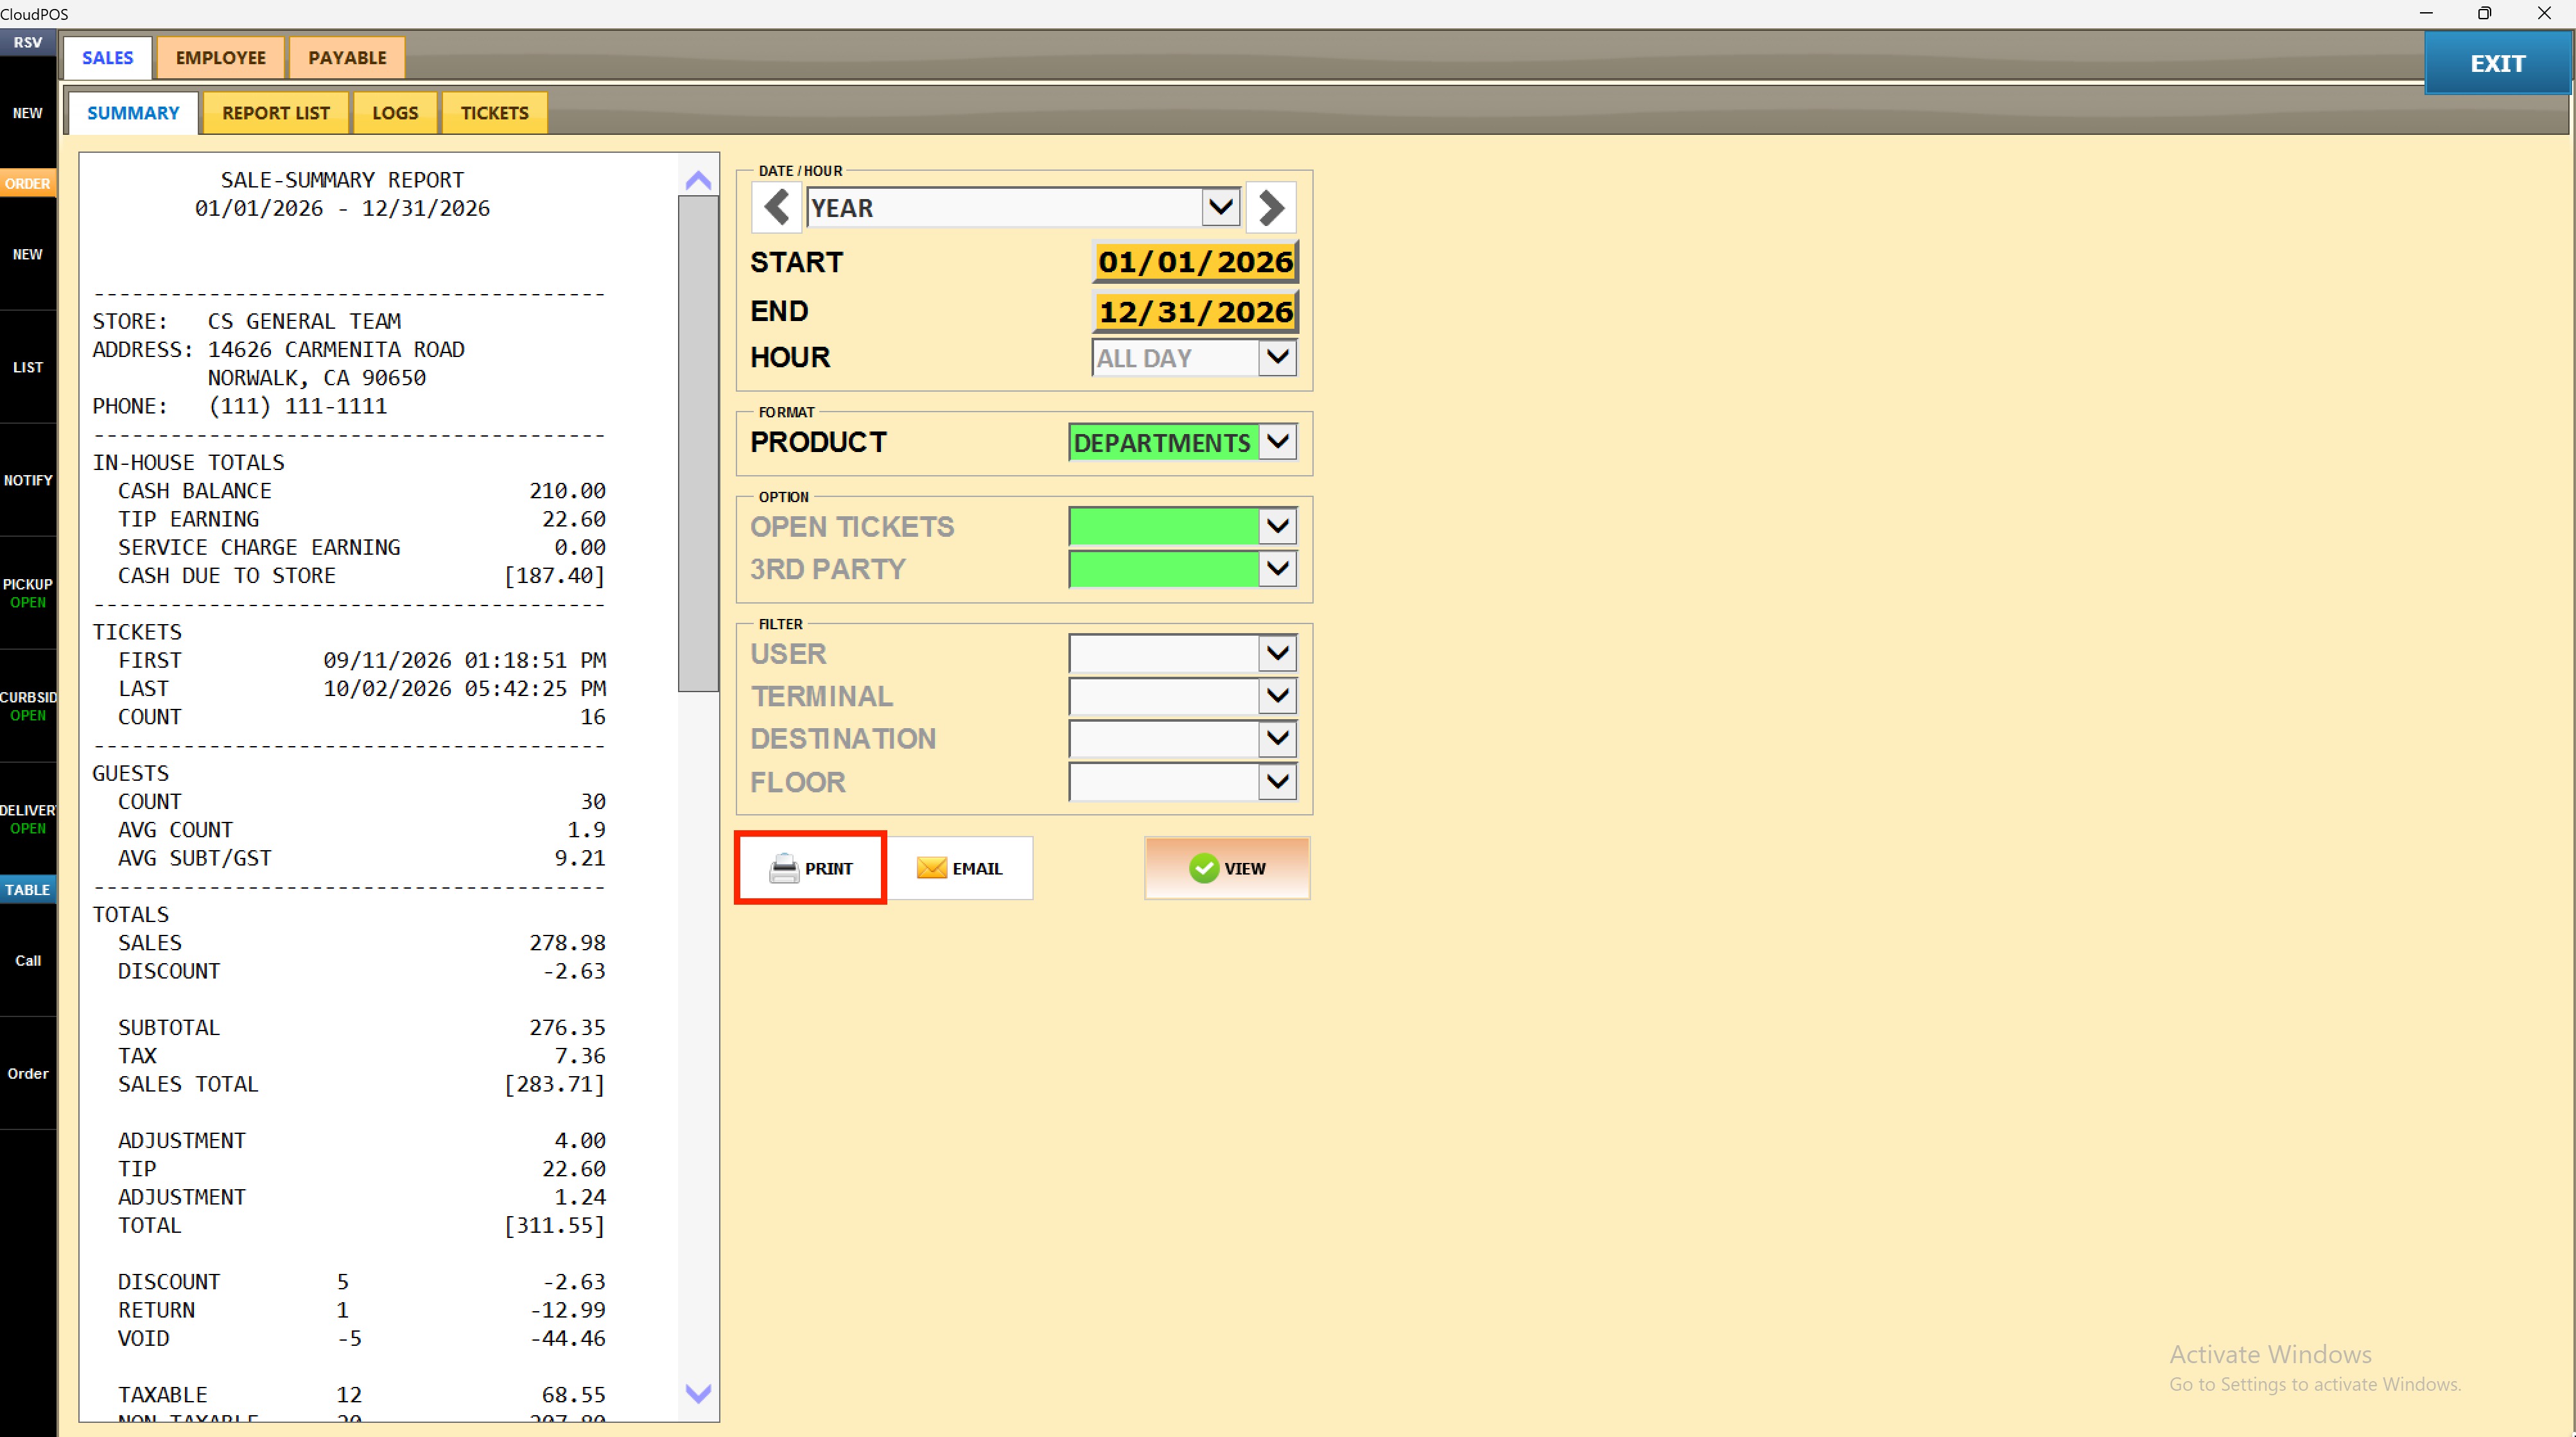
EMAIL
Select EMAIL to send the report via email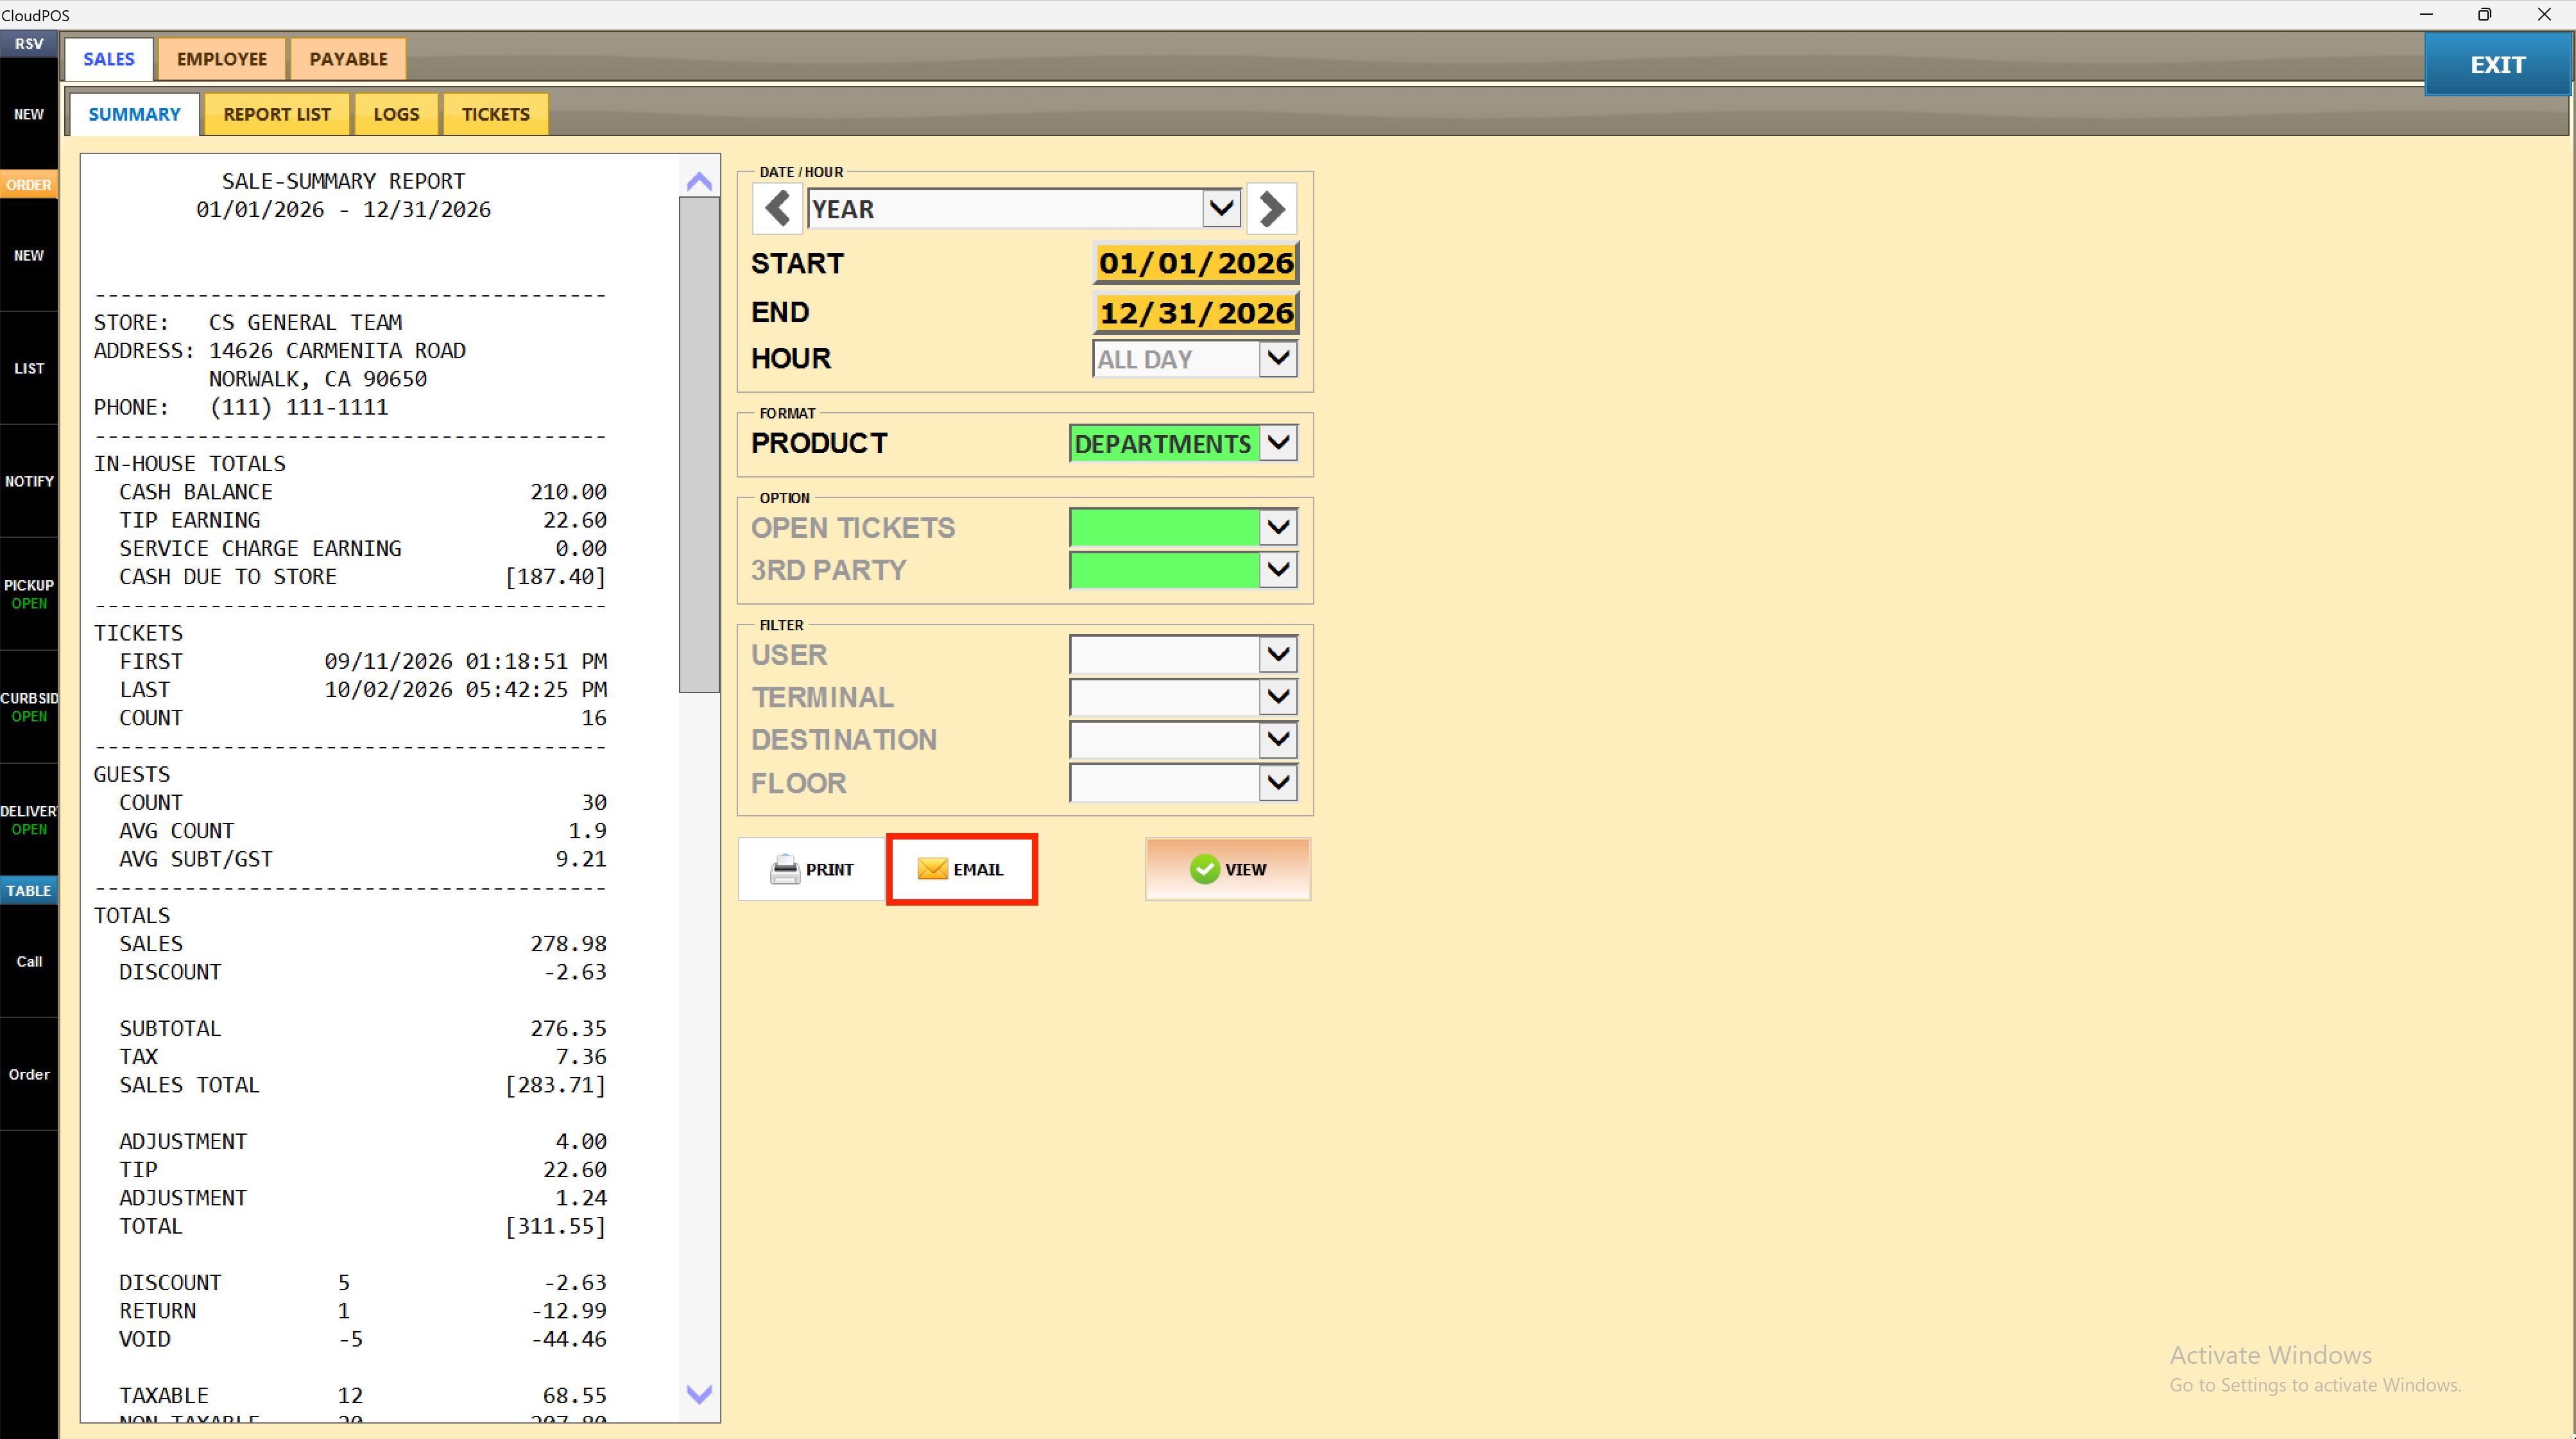
VIEW
Once all filters are configured, choose VIEW to display the customized report
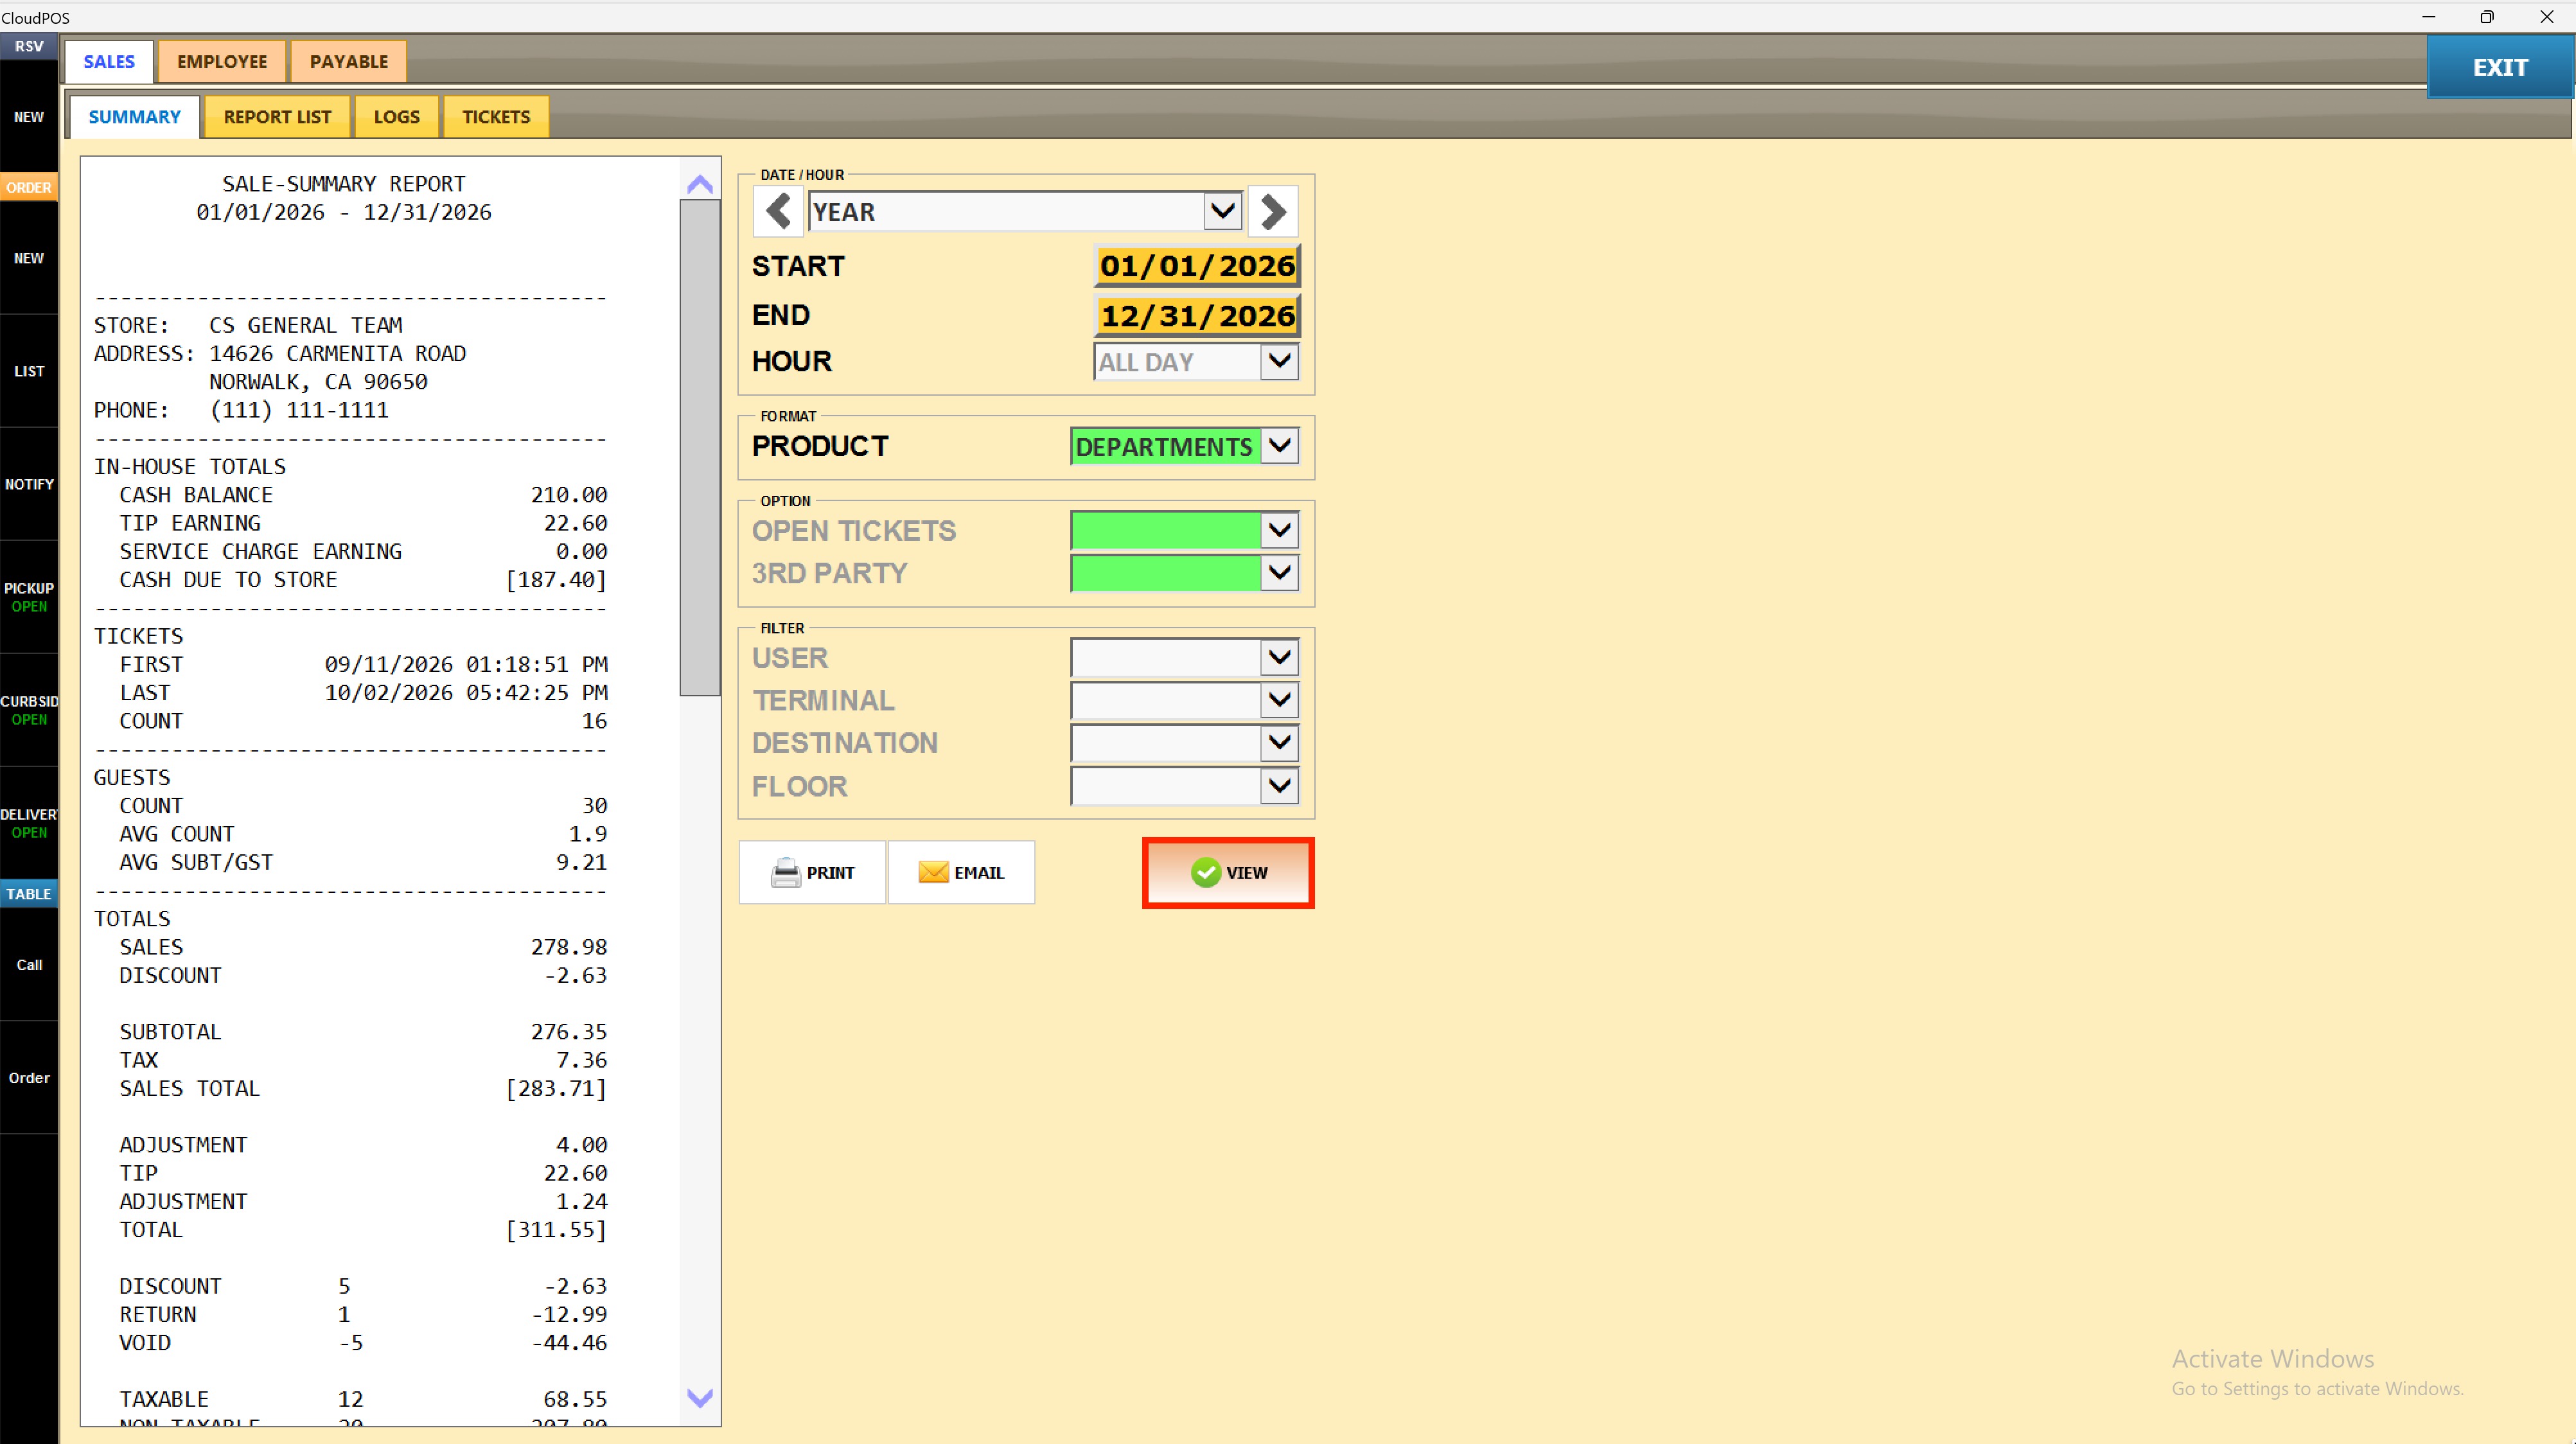
Result:
The report preview on the left displays the Sales Summary Report, including store information, in-house totals, ticket counts, guest counts, sales totals, adjustments, discounts, returns, voids, taxable and non-taxable amounts, service charges, destination and server breakdowns, taxes by type, payments by tender, and product sales by department.