Department
The Department report shows how much each department sold in a selected date range. Use it to see which areas of your menu bring in the most sales.
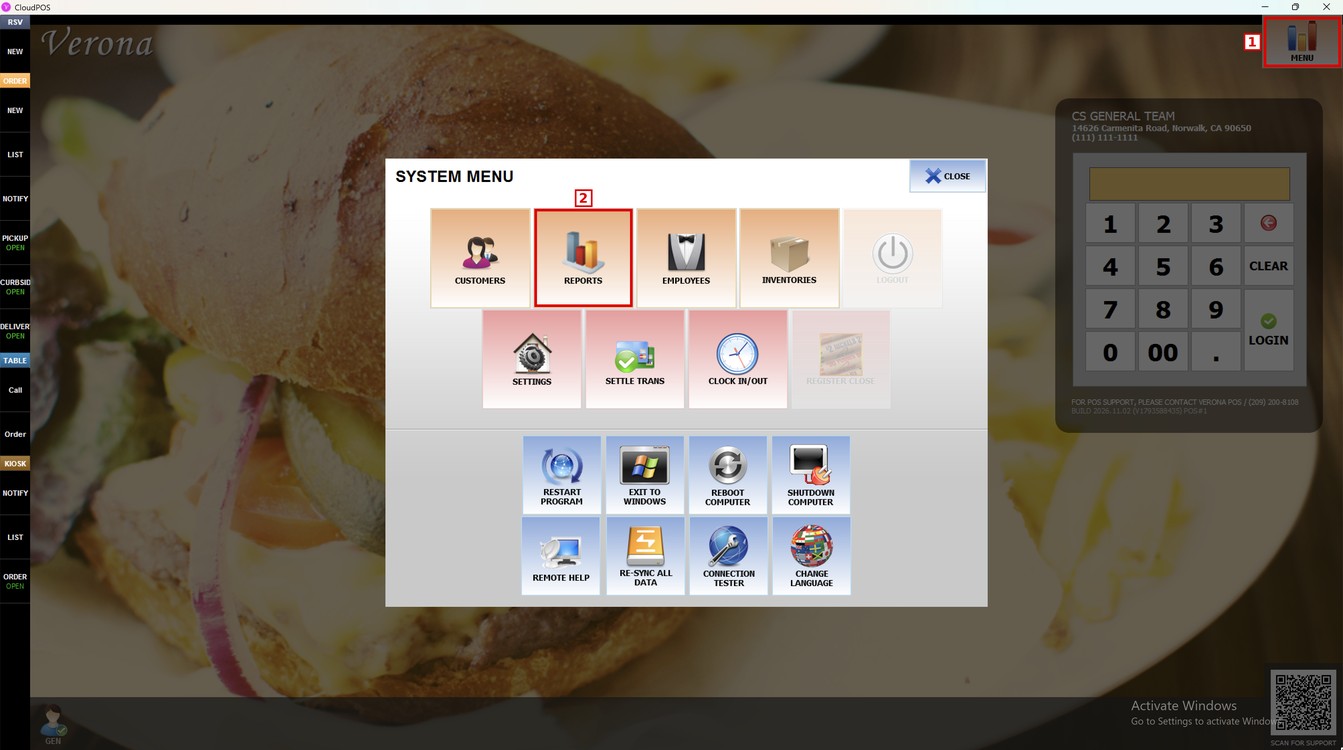
Main Screen> MENU> REPORTS> SALES> REPORT LIST> DEPARTMENT
Press MENU and then REPORTS.
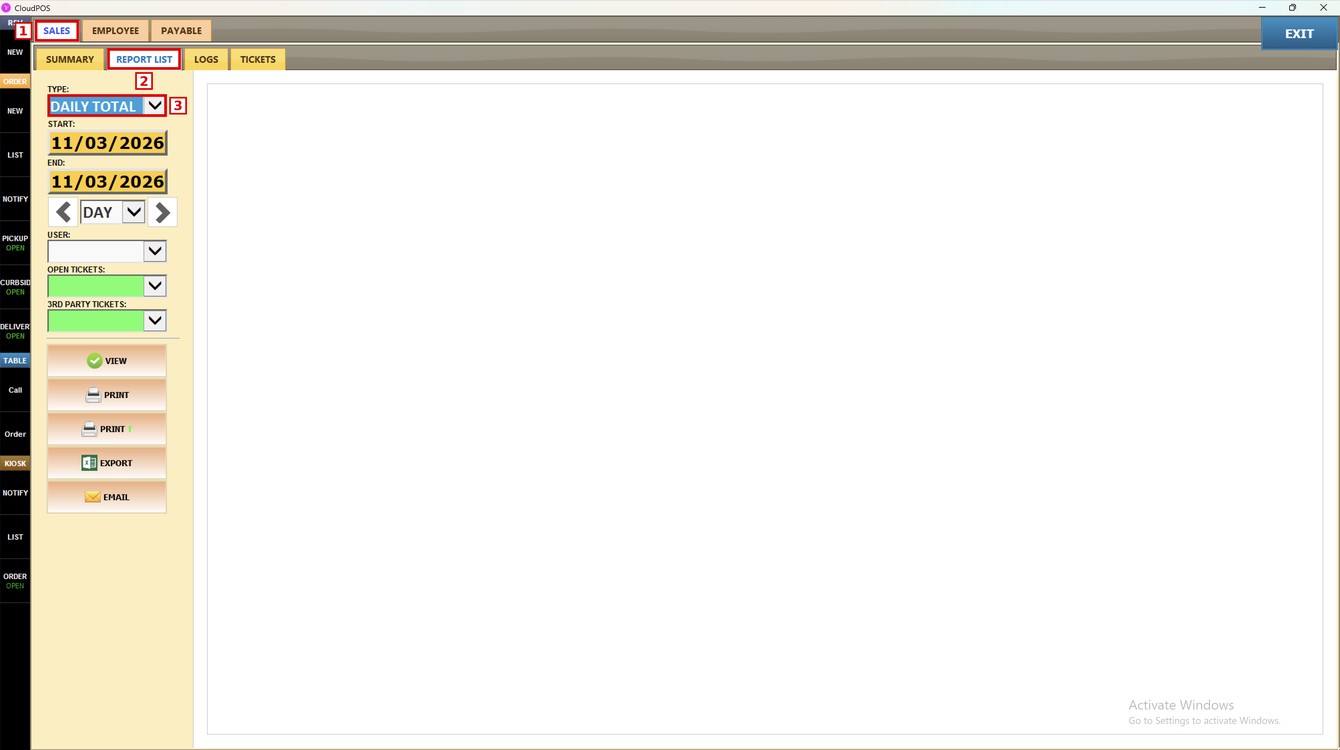
Go to the SALES tab, open REPORT LIST and press the TYPE dropdown.
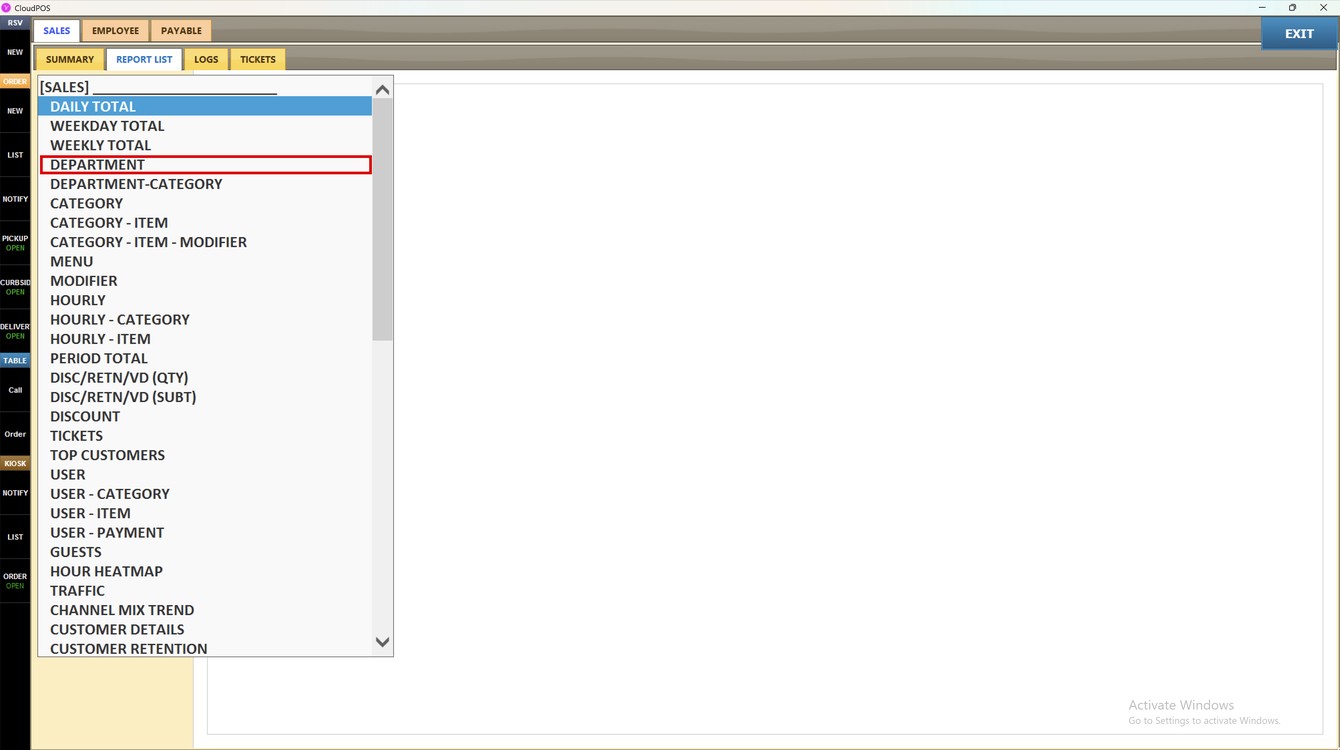
Select DEPARTMENT.
Filters and Buttons:
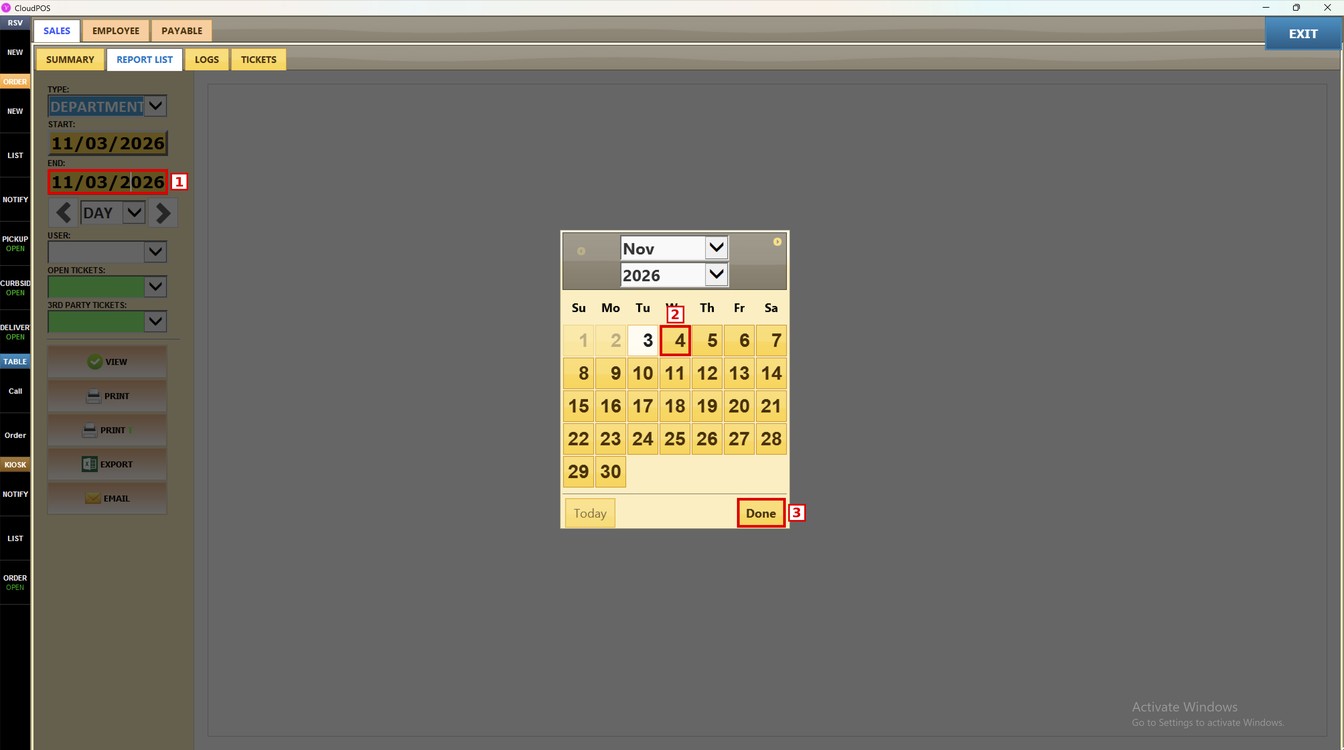
1. START: press the date field, select the first day of the range and press DONE.
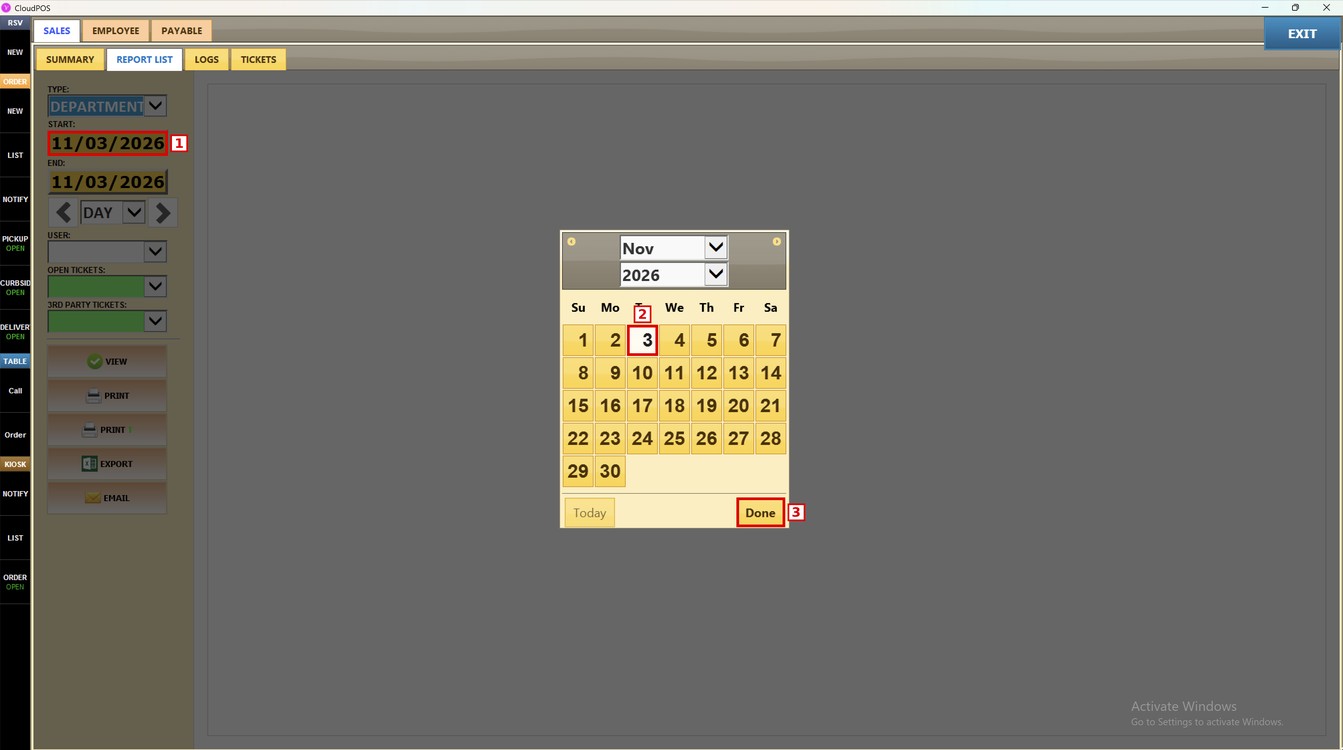
2. END: press the date field, select the last day of the range and press DONE. Days before the start date cannot be selected.
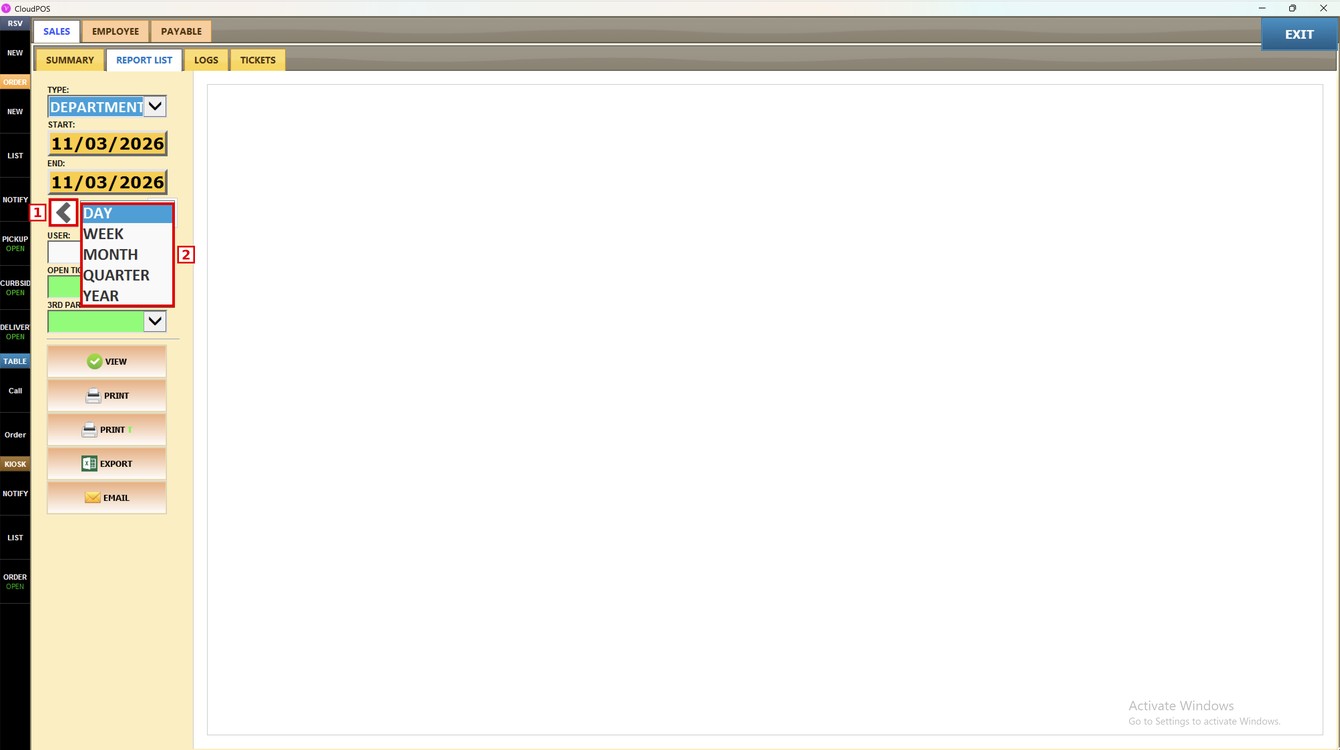
3. PERIOD: choose DAY, WEEK, MONTH, QUARTER or YEAR to fill the dates automatically. Use the arrows to move to the previous or next period.
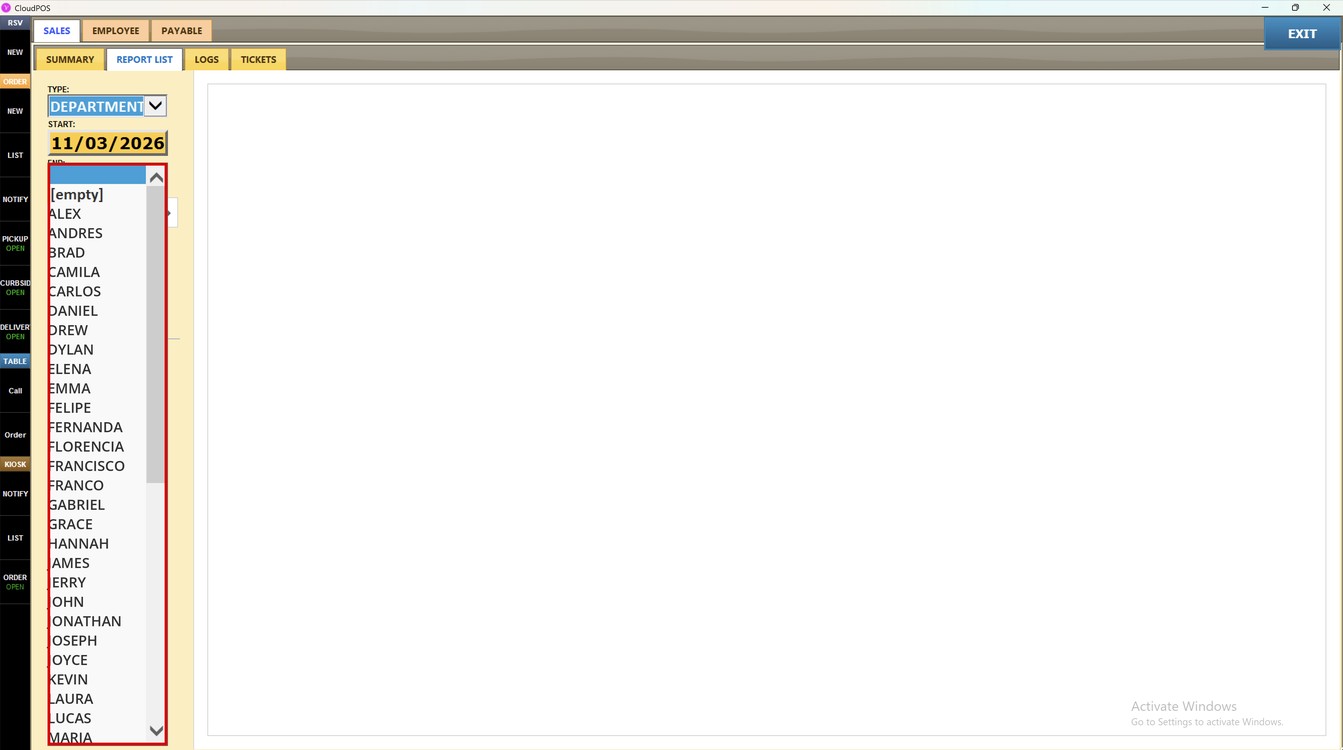
4. USER: select an employee to see only their sales. Leave it empty to see all employees.
5. OPEN TICKETS: select YES to include tickets that are still open.

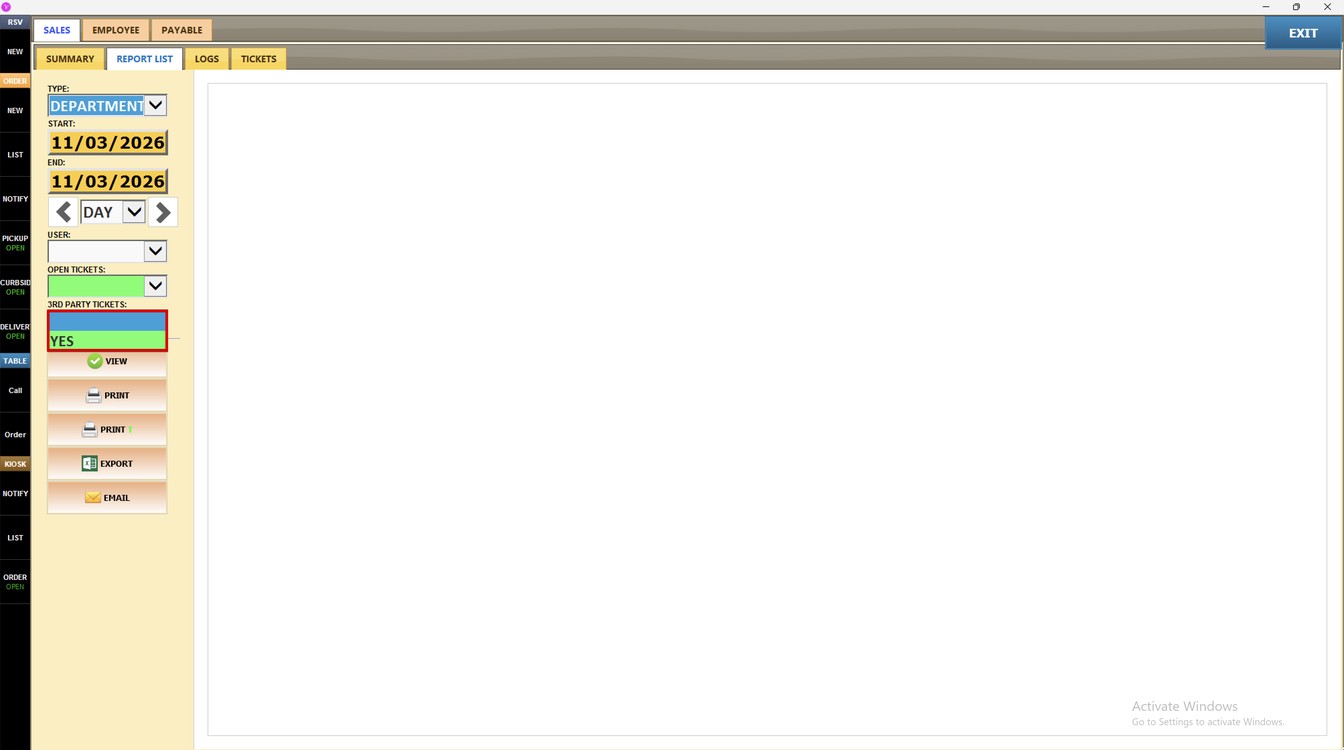
6. 3RD PARTY TICKETS: select YES to include tickets from third-party sources.
Press VIEW to show the report.
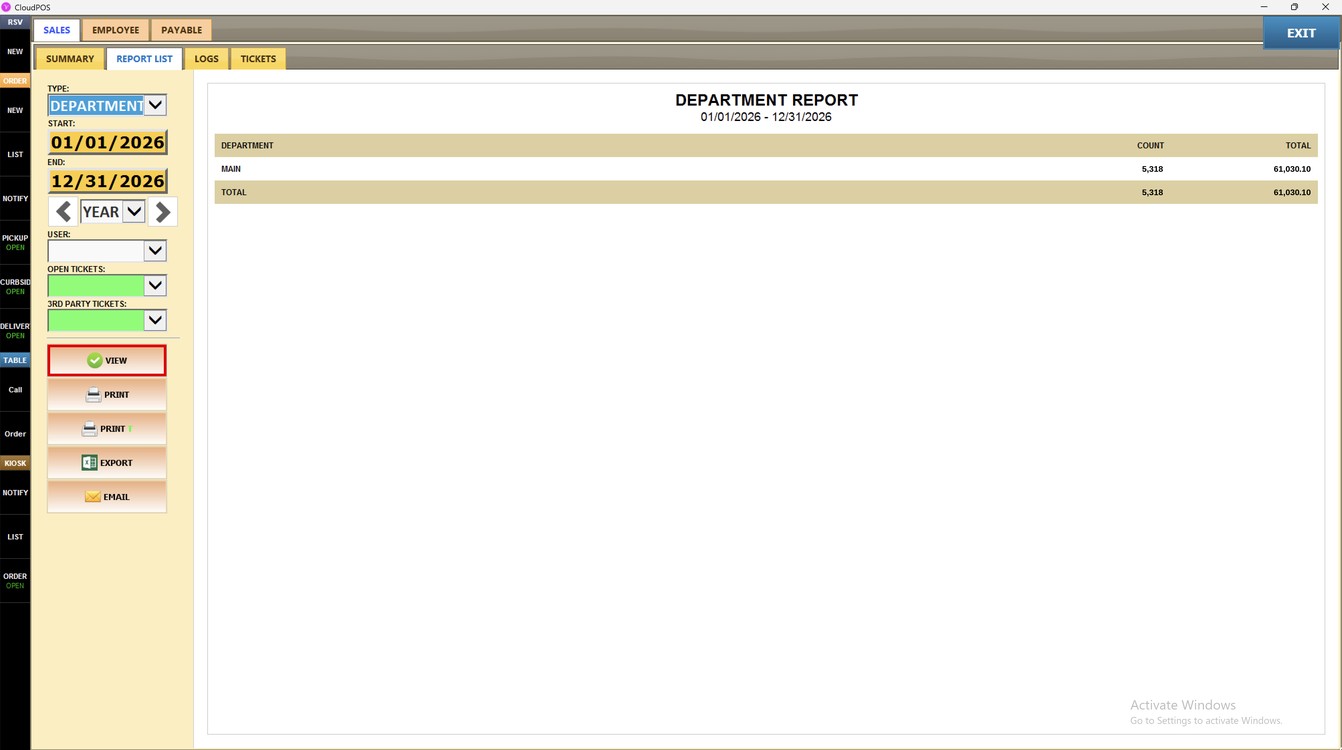
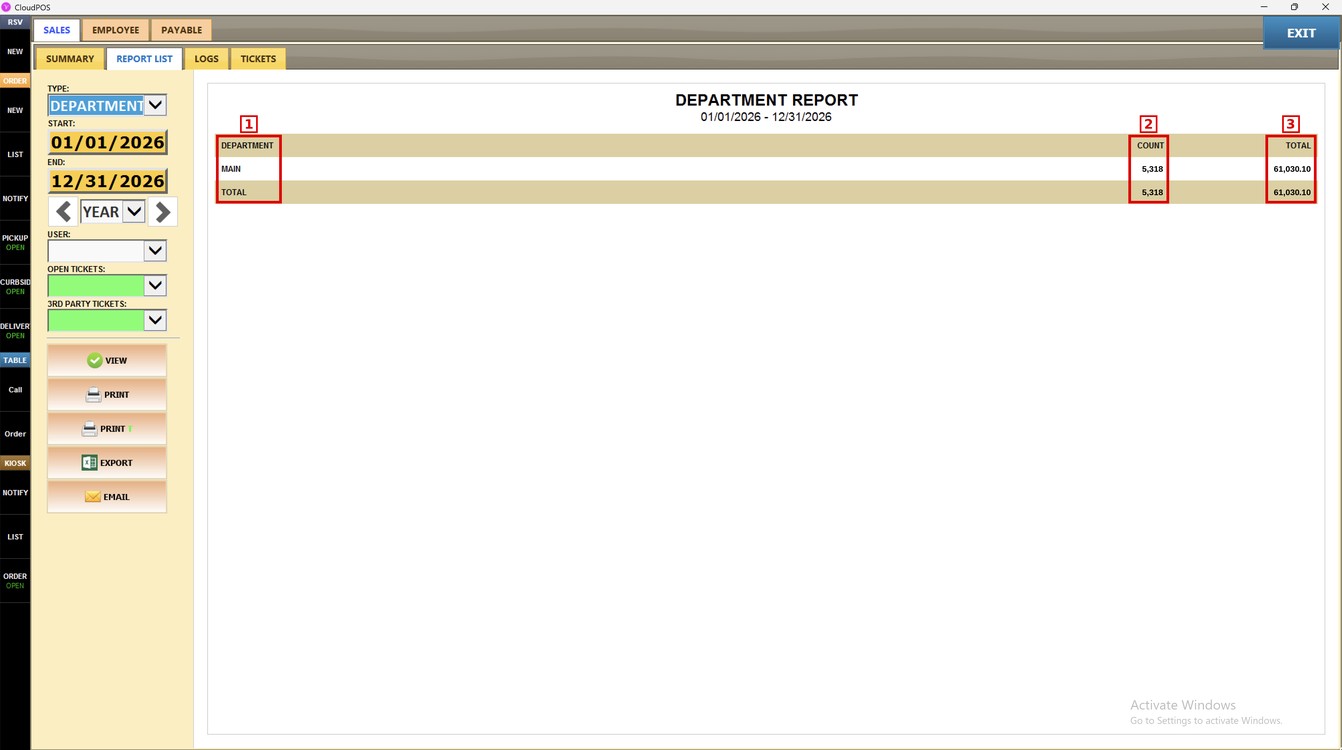
Each row is one department. The last row shows the TOTAL of all departments.
1. DEPARTMENT: name of the department.
2. COUNT: number of items sold in the department.
3. TOTAL: sales amount of the department.
Additional Options:
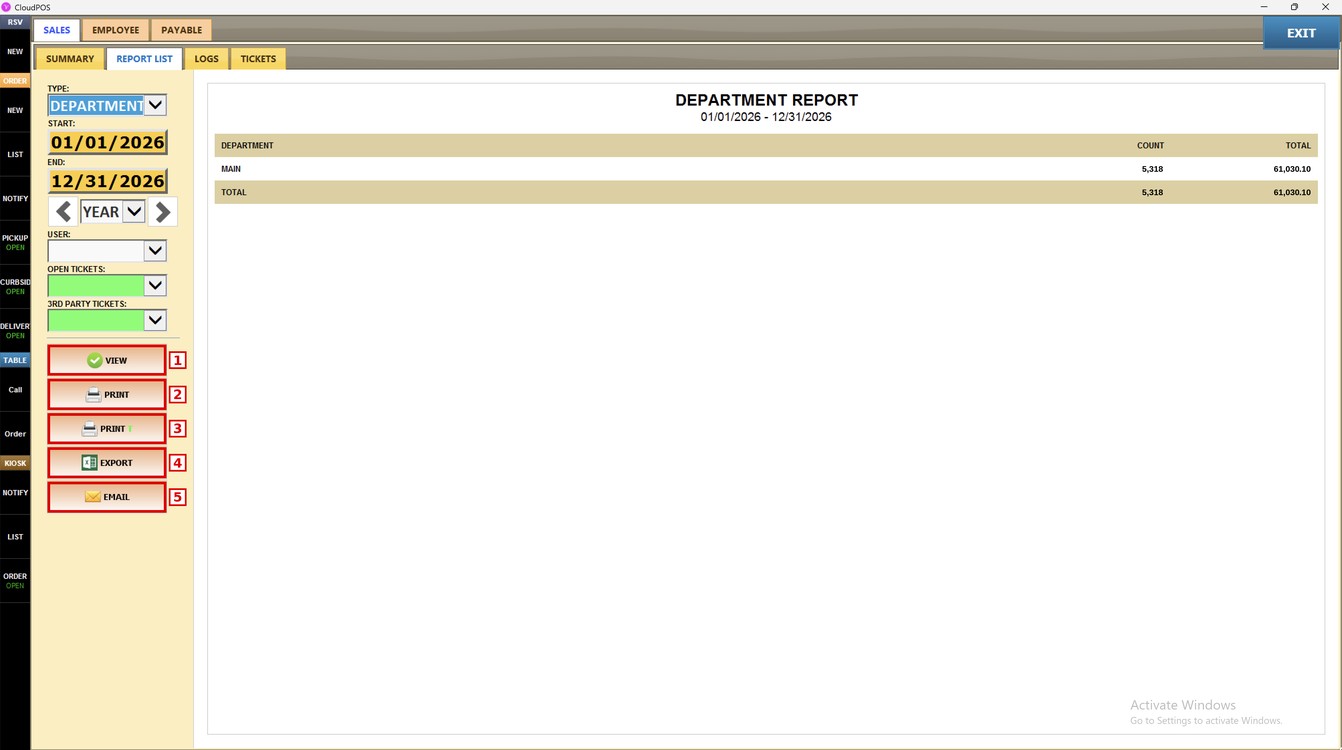
1. VIEW: for the report information to be displayed.
2. PRINT: generates a printable version of the report.
3. PRINT T: prints the report on the receipt printer.
4. EXPORT: exports the report to an Excel file.
5. EMAIL: sends the report by email.
Hint: Select YEAR in the period dropdown to compare your departments over the whole year.
To learn how to see your sales week by week, please refer to the Weekly Total Guide.