Period
This section shows the store’s sales grouped by time period. The Weekday Sales report compares sales across the days of the week, and the Weekly Sales report compares sales from week to week, so you can spot your busiest days and follow sales trends over time.
REPORTS> SALES> PERIOD
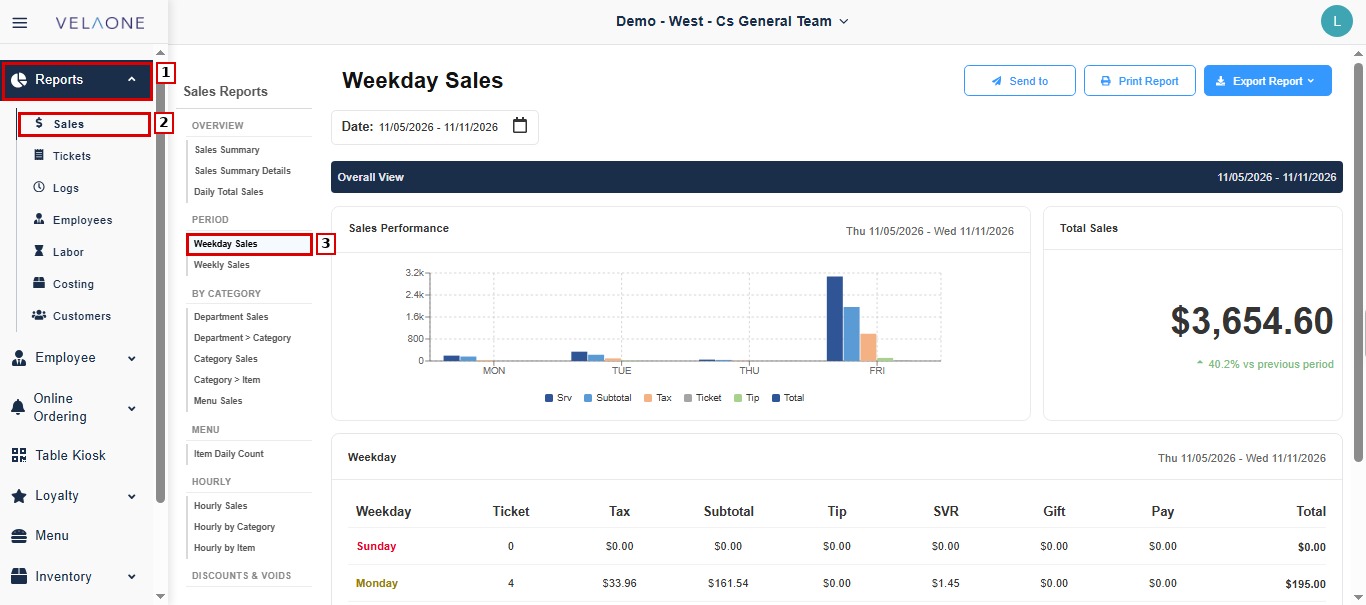
From the left menu, click REPORTS, then select SALES. In the SALES REPORTS panel, under PERIOD, select the report you want to view.
Weekday Sales
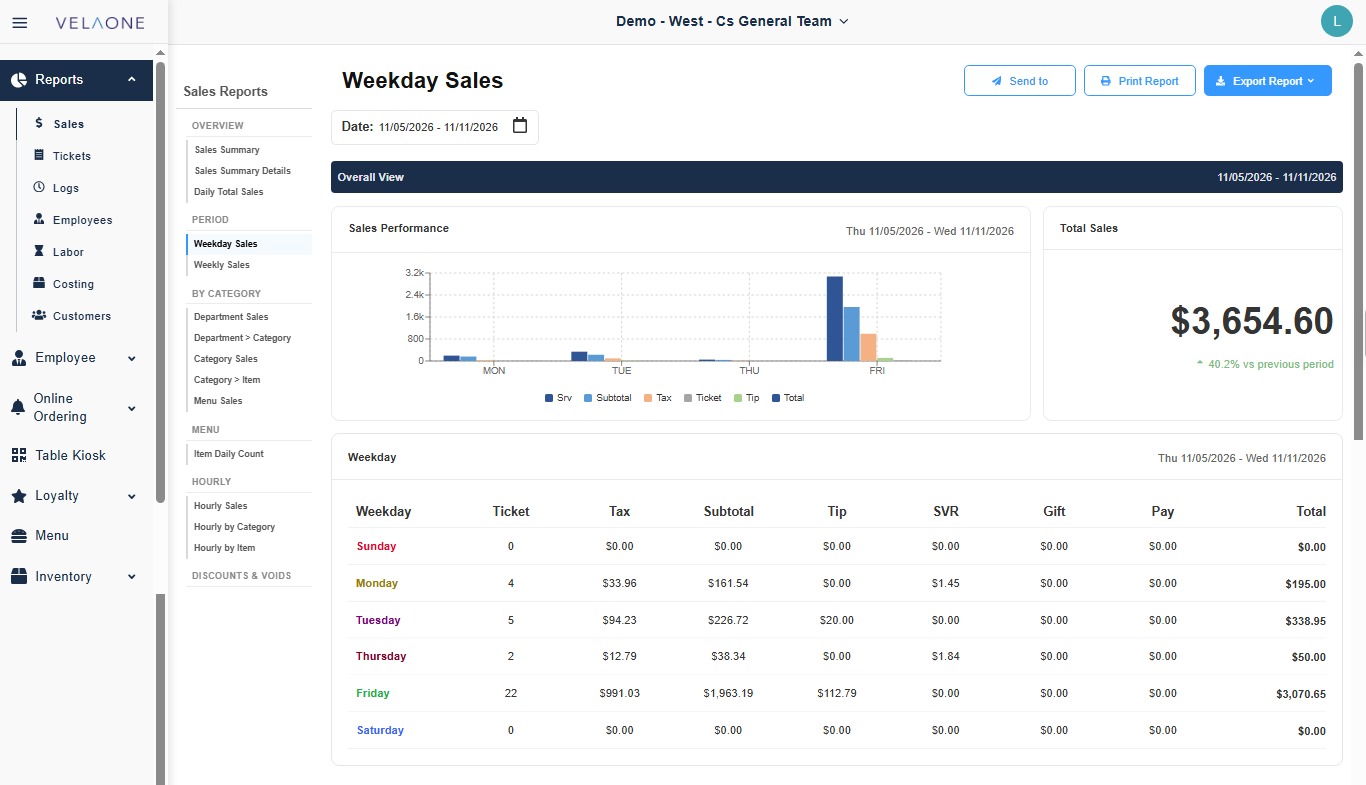
This report shows the sales for the selected date range broken down by day of the week, from Sunday to Saturday. Use it to compare how each day performs and identify your strongest and slowest days.
In the SALES REPORTS panel, under PERIOD, click WEEKDAY SALES.
FILTERS
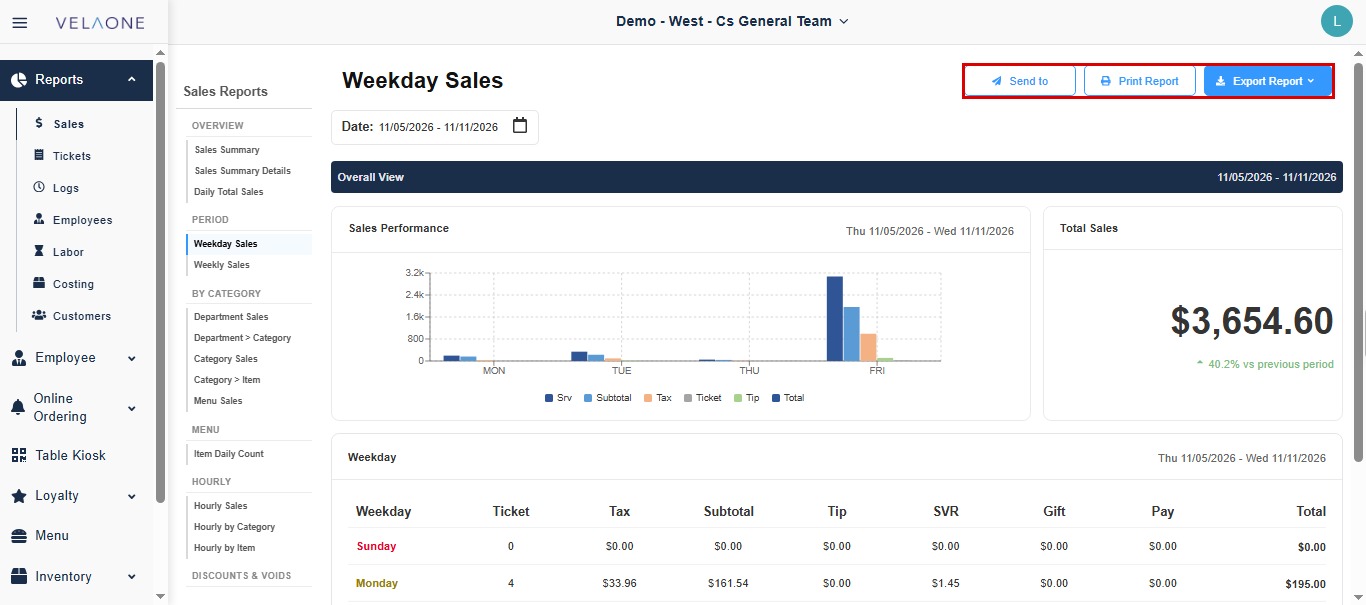
The filter and report buttons are at the top of the report.
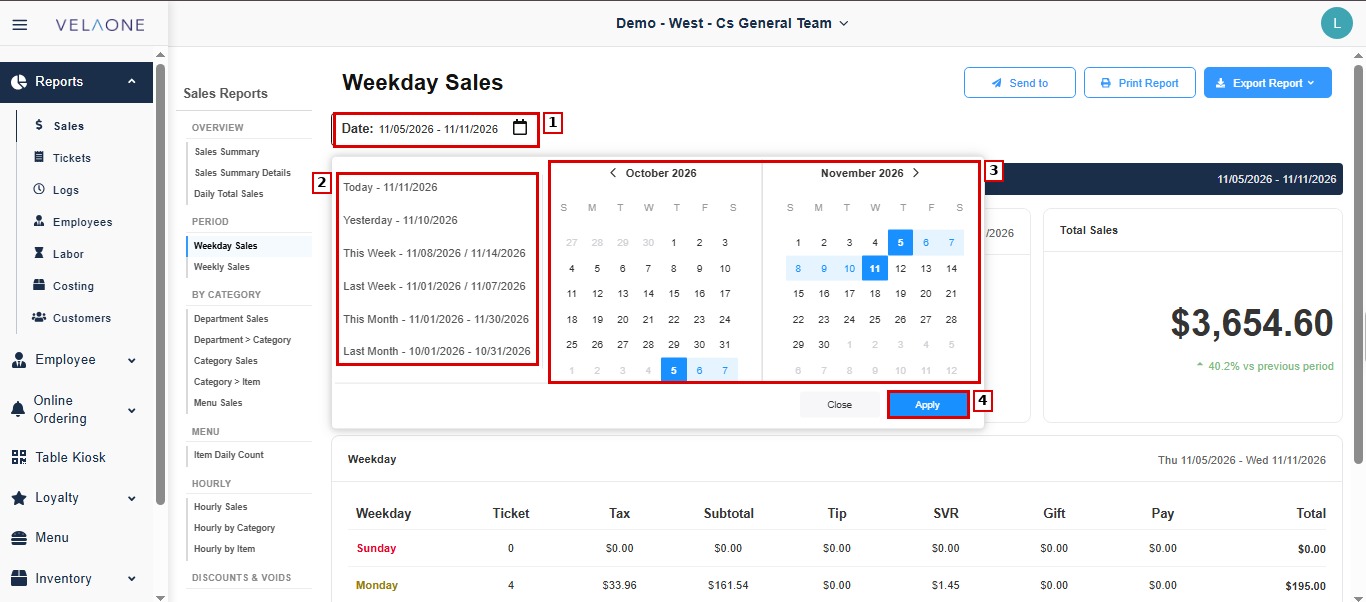
DATE: sets the period the report covers.
Click the DATE field to open the calendar. Select a preset period from the list on the left: TODAY, YESTERDAY, THIS WEEK, LAST WEEK, THIS MONTH or LAST MONTH. You can also click the start and end dates directly on the calendars, using the arrows next to the month names to move to earlier or later months. Click APPLY to load the report, or CLOSE to exit without changes.
EXPORT OPTIONS
SEND TO: sends the report to a recipient.
PRINT REPORT: prints the report as it is displayed.
EXPORT REPORT: downloads the report. Click EXPORT REPORT, then select the file format.
OVERALL VIEW
The bar at the top of this section shows the date range currently loaded.
Sales Performance: shows a bar chart that compares Srv, Subtotal, Tax, Ticket, Tip and Total for each weekday with sales in the selected period.
Total Sales: shows the grand total for the period, with a percentage badge that compares it with the previous period. Green indicates an increase and red a decrease.
Weekday: shows a table with one row per day of the week and these columns: Weekday, Ticket, Tax, Subtotal, Tip, SVR (total service charges), Gift (amount collected from Gift Cards), Pay, and Total.
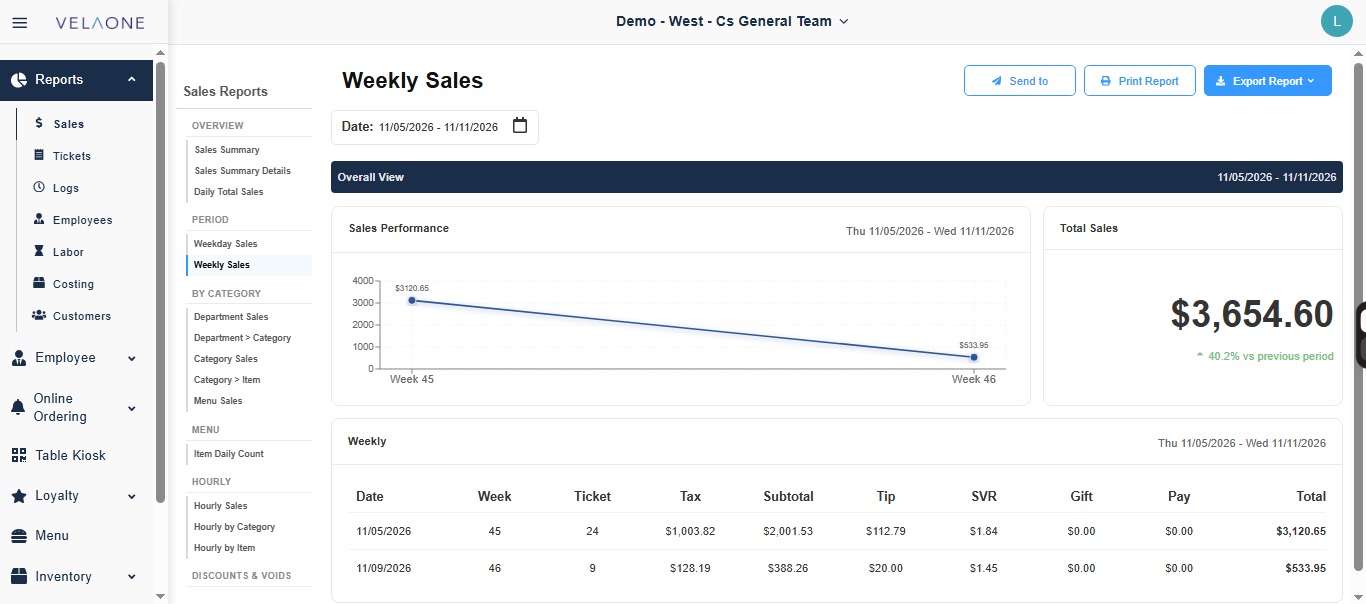
Weekly Sales
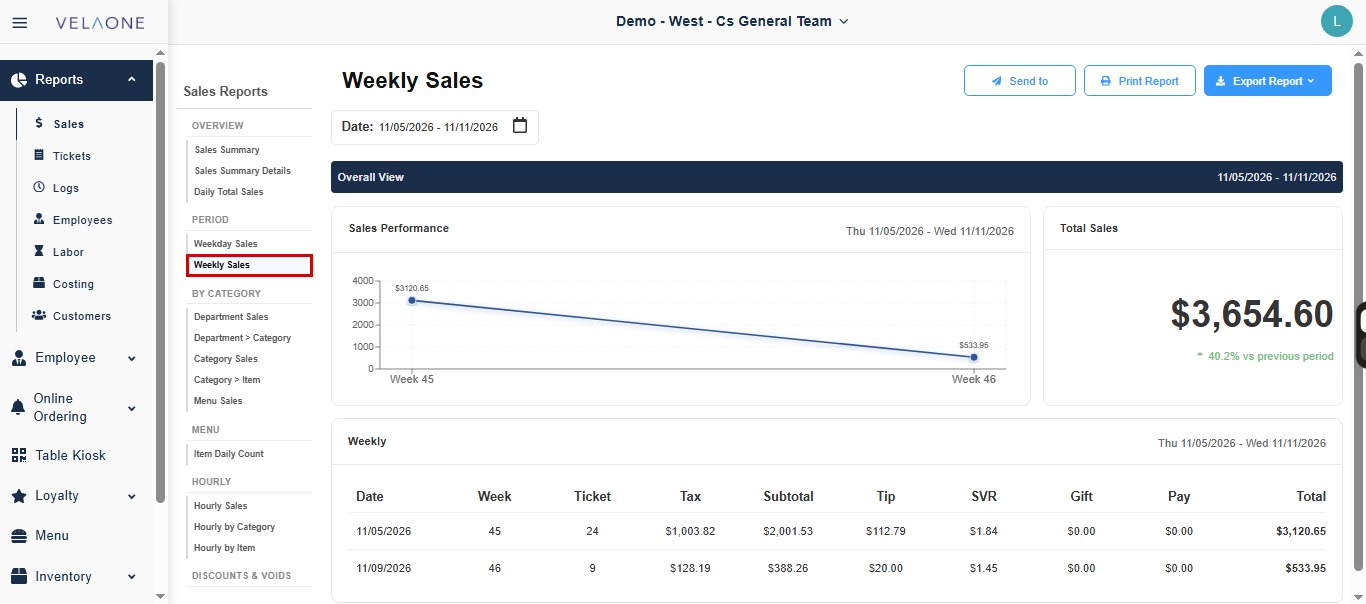
This report shows the sales for the selected date range grouped by week. Use it to compare totals from one week to the next and follow how sales change over time.
In the SALES REPORTS panel, under PERIOD, click WEEKLY SALES.
FILTERS
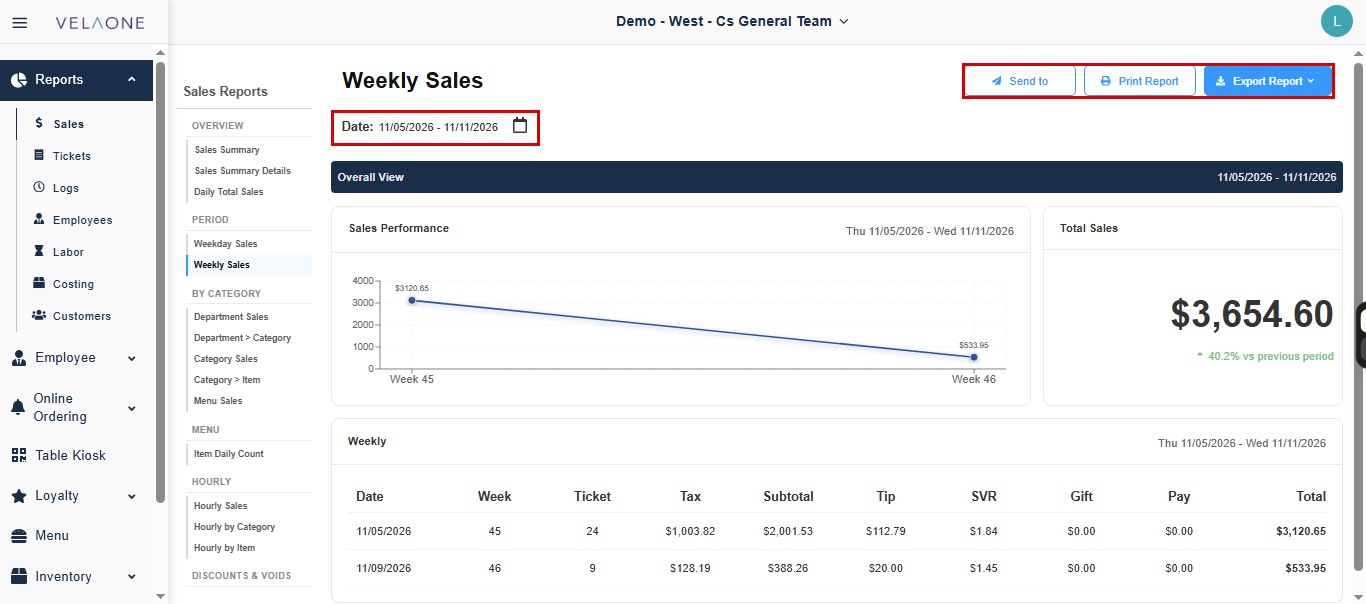
The filter and report buttons are at the top of the report.
DATE: sets the period the report covers.
Click the DATE field to open the calendar. Select a preset period from the list on the left: TODAY, YESTERDAY, THIS WEEK, LAST WEEK, THIS MONTH or LAST MONTH. You can also click the start and end dates directly on the calendars, using the arrows next to the month names to move to earlier or later months. Click APPLY to load the report, or CLOSE to exit without changes.
EXPORT OPTIONS
SEND TO: sends the report to a recipient.
PRINT REPORT: prints the report as it is displayed.
EXPORT REPORT: downloads the report. Click EXPORT REPORT, then select the file format.
OVERALL VIEW
The bar at the top of this section shows the date range currently loaded.
Sales Performance: shows a line chart with the total sales of each week in the selected period, labeled by week number (for example, Week 45 and Week 46).
Total Sales: shows the grand total for the period, with a percentage badge that compares it with the previous period. Green indicates an increase and red a decrease.
Weekly: shows a table with one row per week and these columns: Date, Week, Ticket, Tax, Subtotal, Tip, SVR, Gift, Pay and Total.