Item Trend
The Item Trend report compares the sales of each menu item between the first half and the second half of the selected dates. It shows which items are rising and which are falling, so the store can see changes in what the customers order.
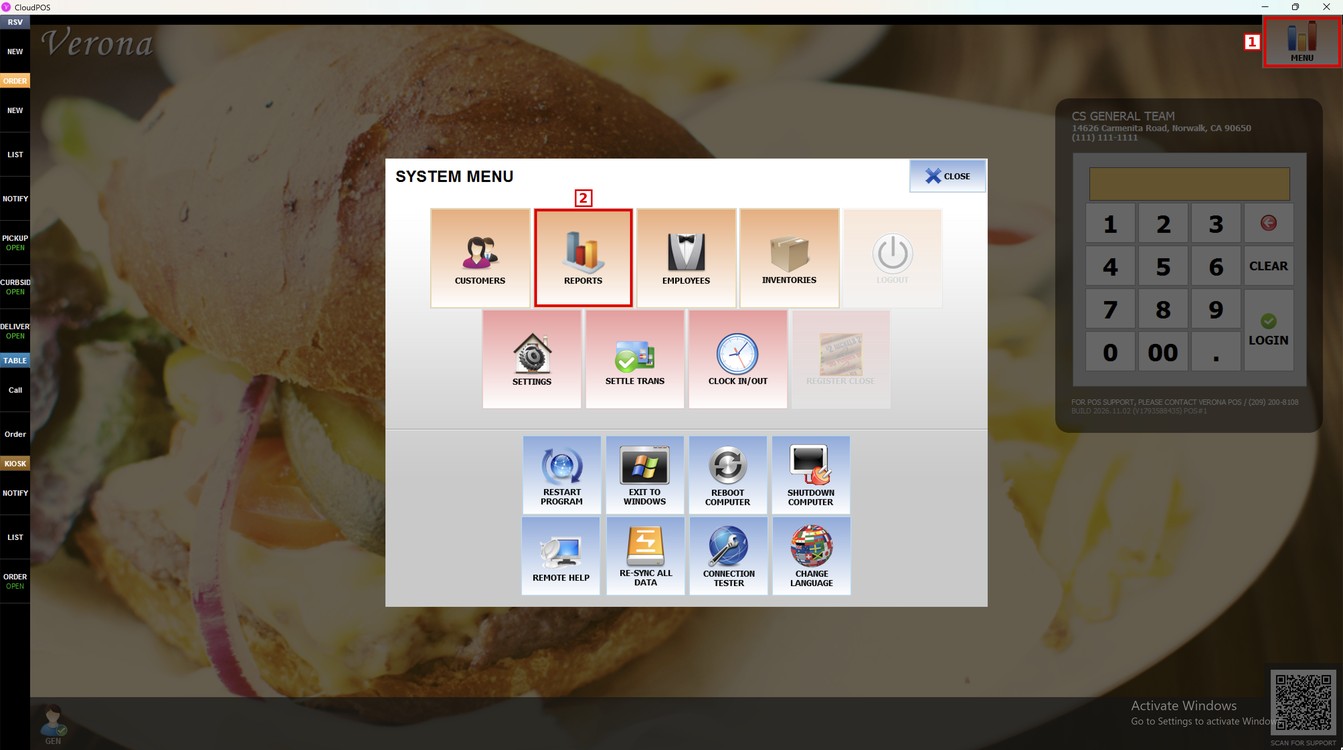
Main Screen> MENU> REPORTS> SALES> REPORT LIST> ITEM TREND
Press MENU and then REPORTS.
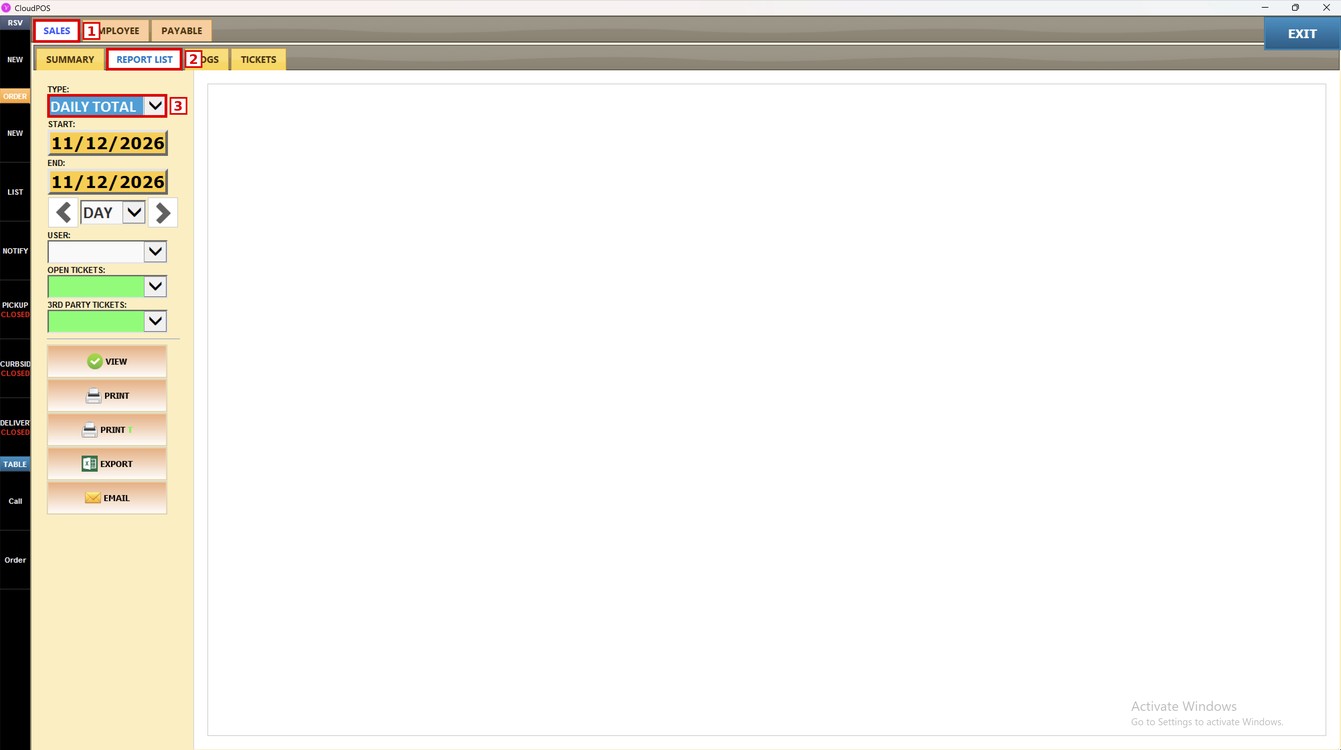
Go to the SALES tab, open REPORT LIST, and press the TYPE dropdown.
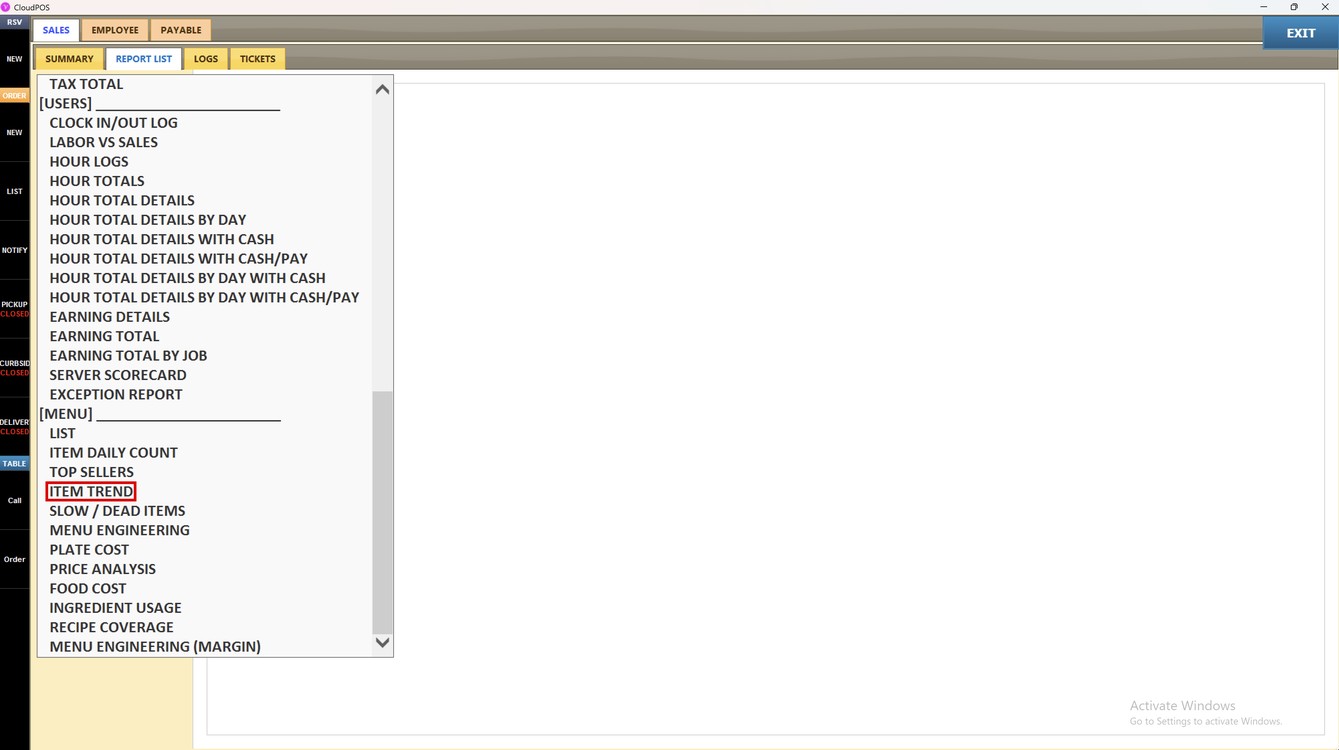
In the [MENU] section, select ITEM TREND.
Filters:
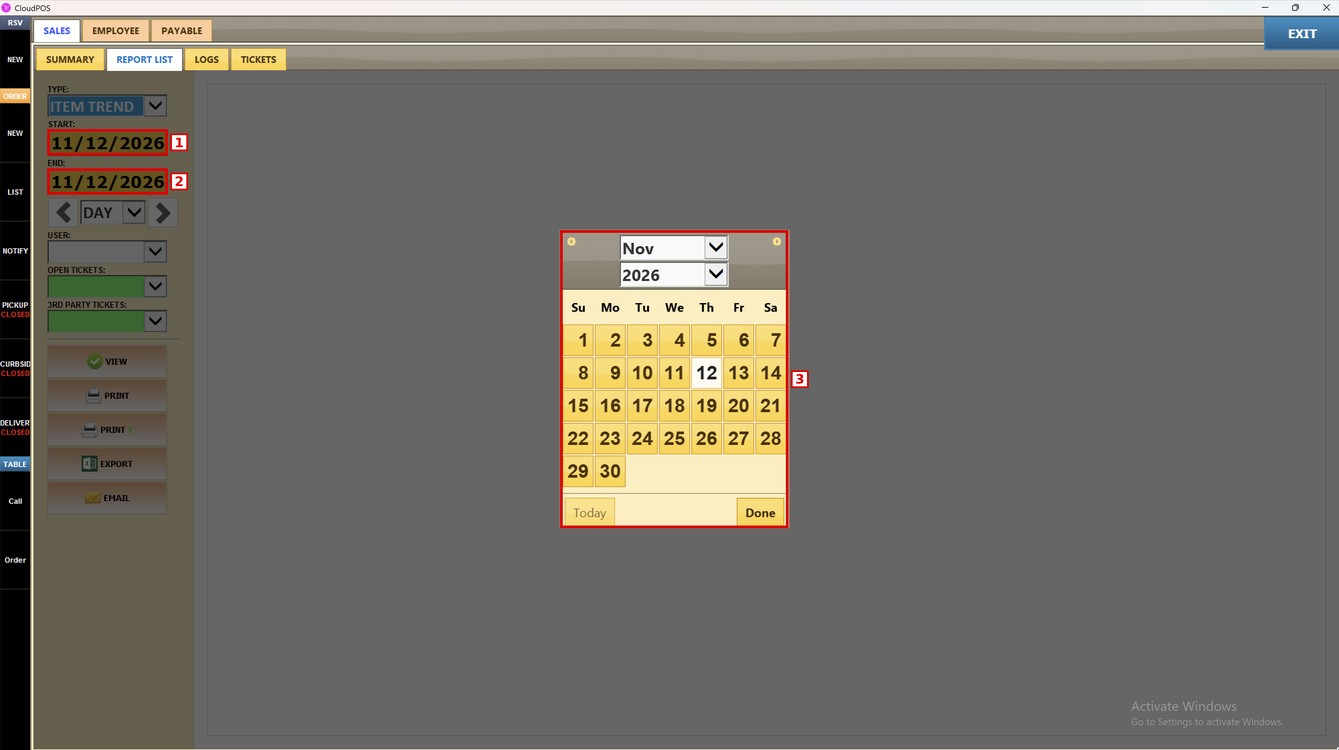
Press START to select the first day and END to select the last day of the report. Select the day in the calendar and press DONE.
Press the period dropdown and select DAY, WEEK, MONTH, QUARTER or YEAR.
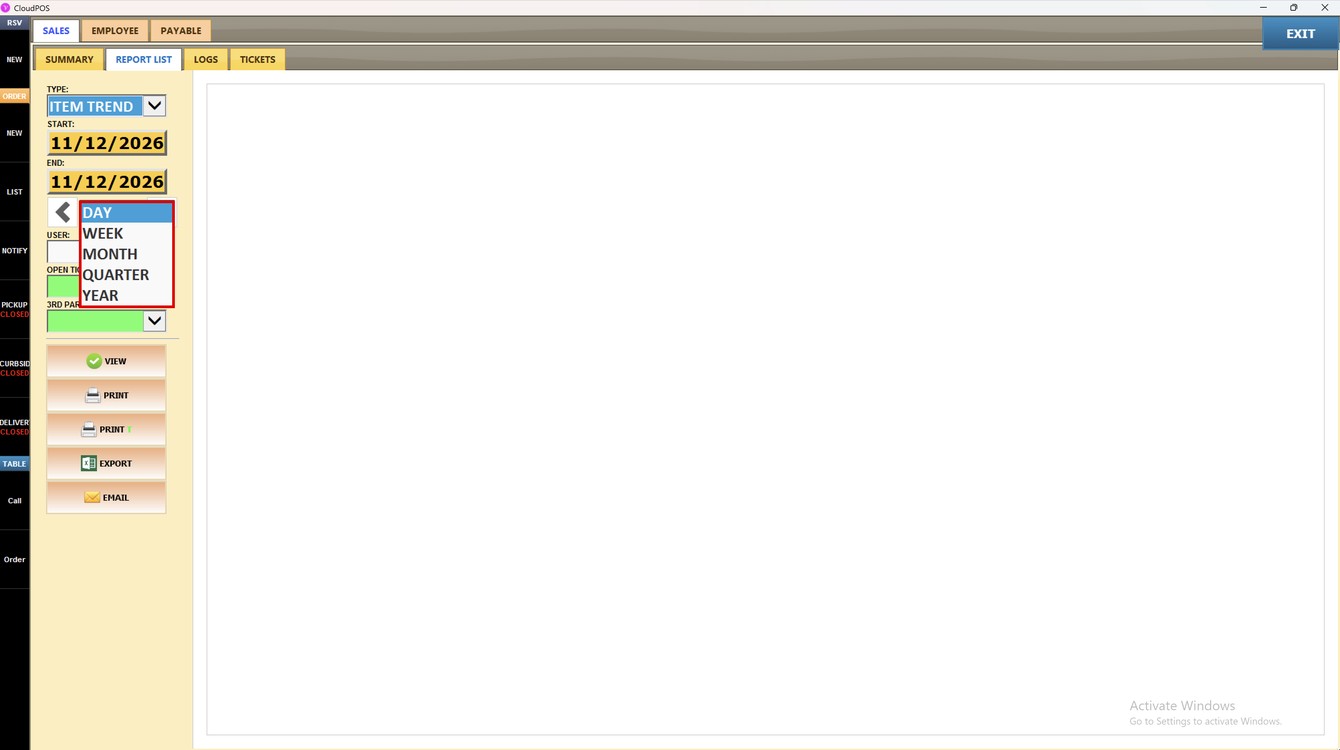
Press the left arrow to go to the previous period or the right arrow to go to the next period. The START and END dates change automatically.
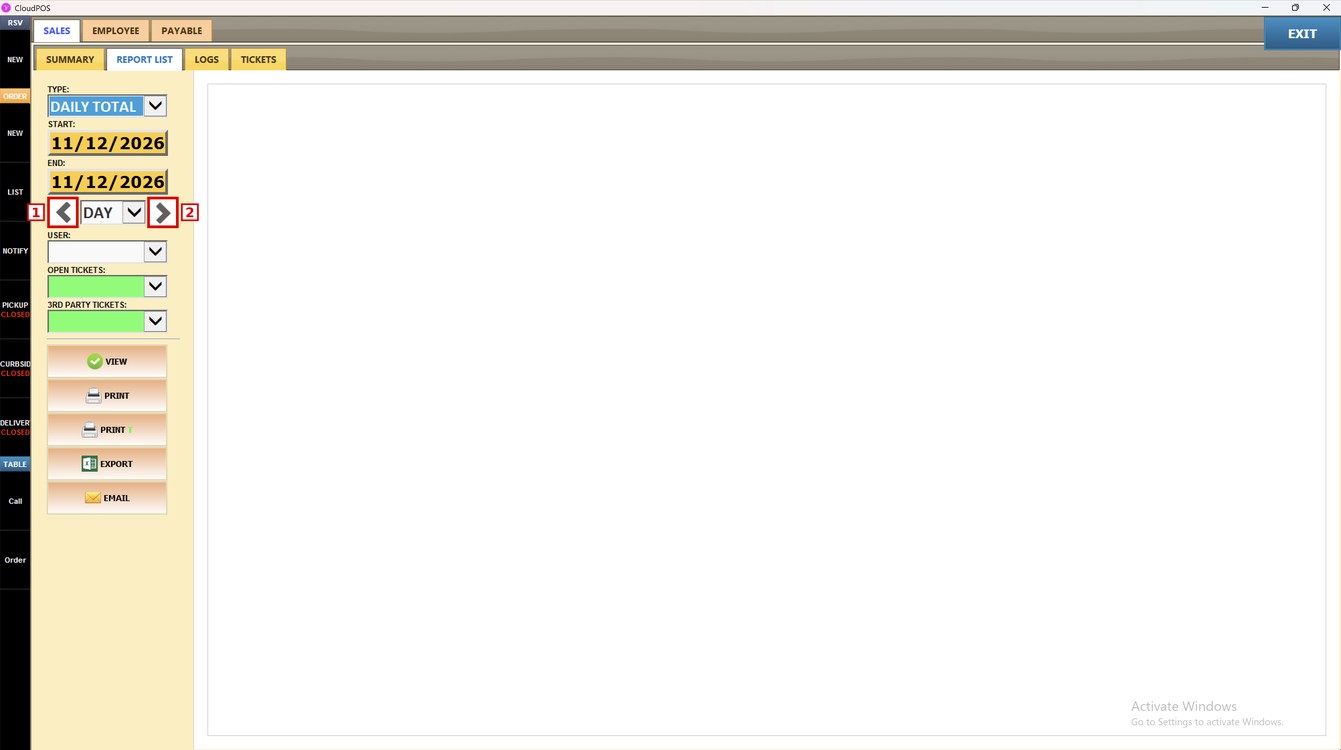
USER: select an employee to see only the sales of that employee. Leave it empty to see all the employees.
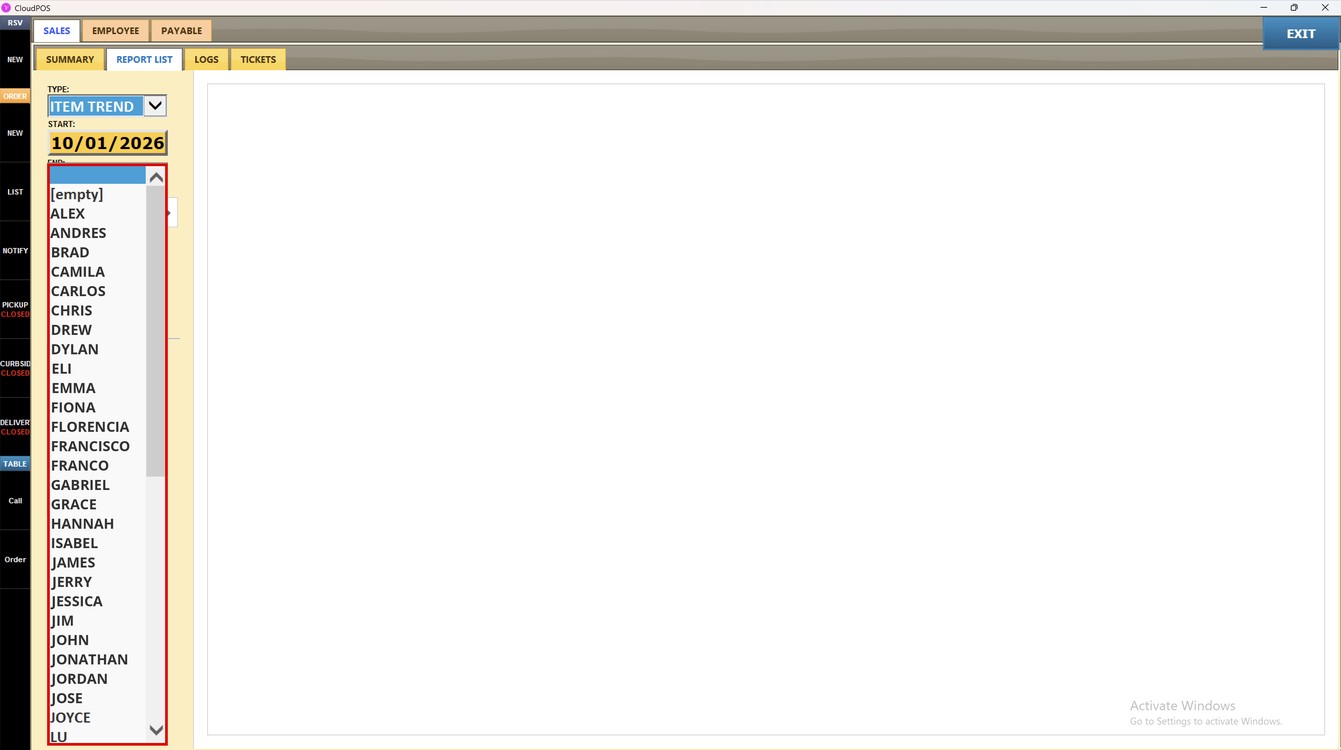
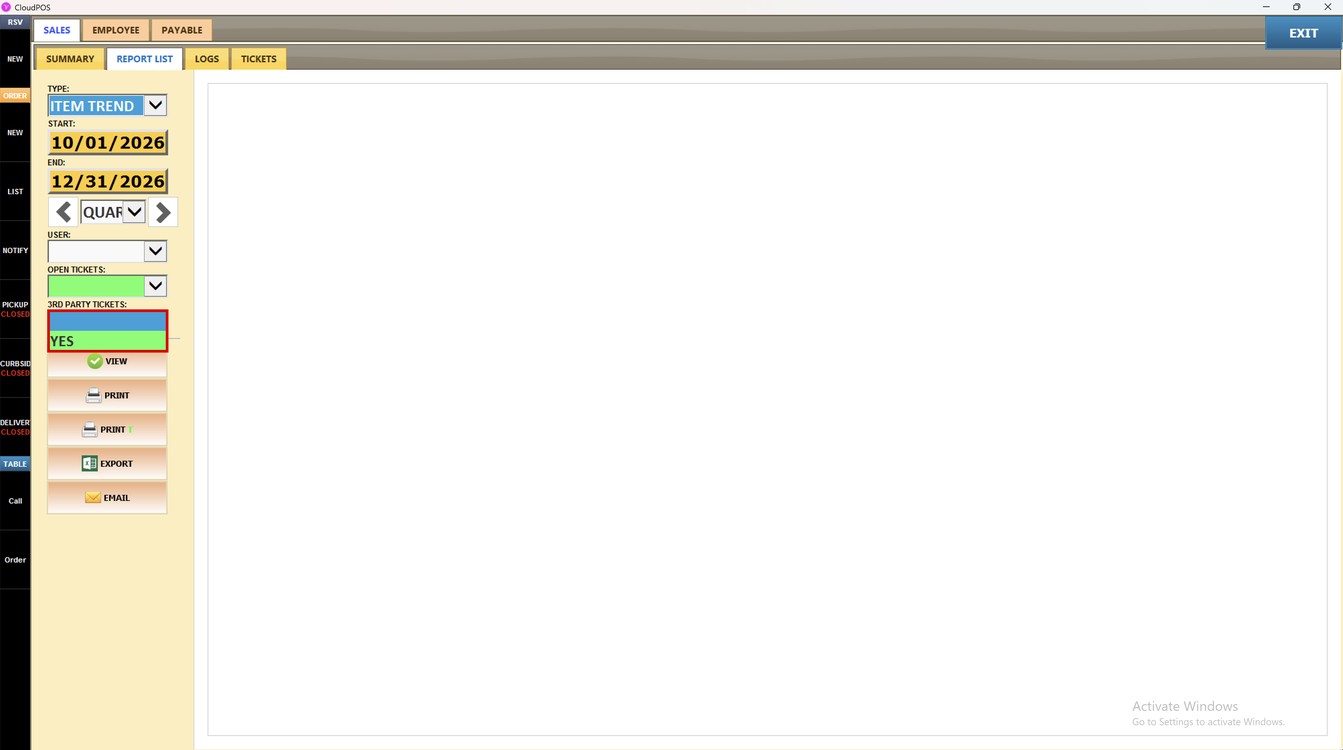
OPEN TICKETS: select YES to include the open tickets in the report.
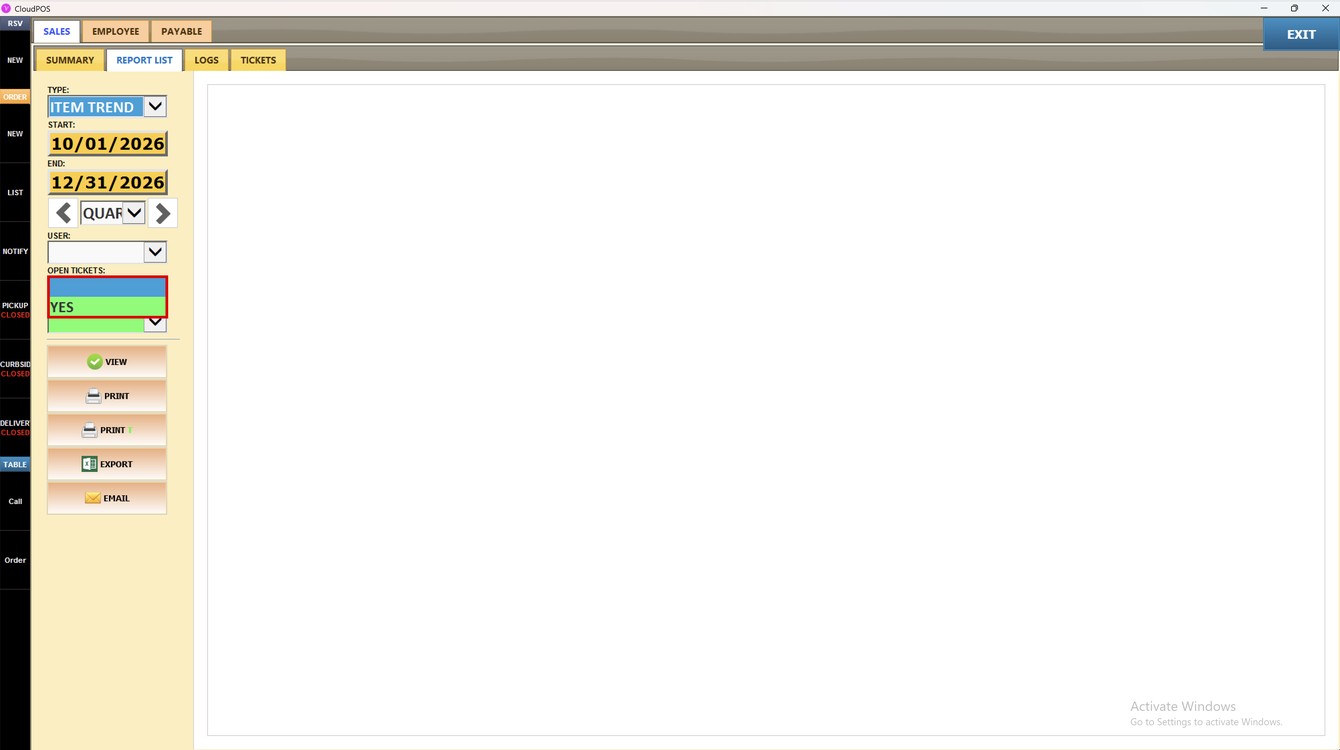
3RD PARTY TICKETS: select YES to include the tickets from third-party services in the report.
View the Report:
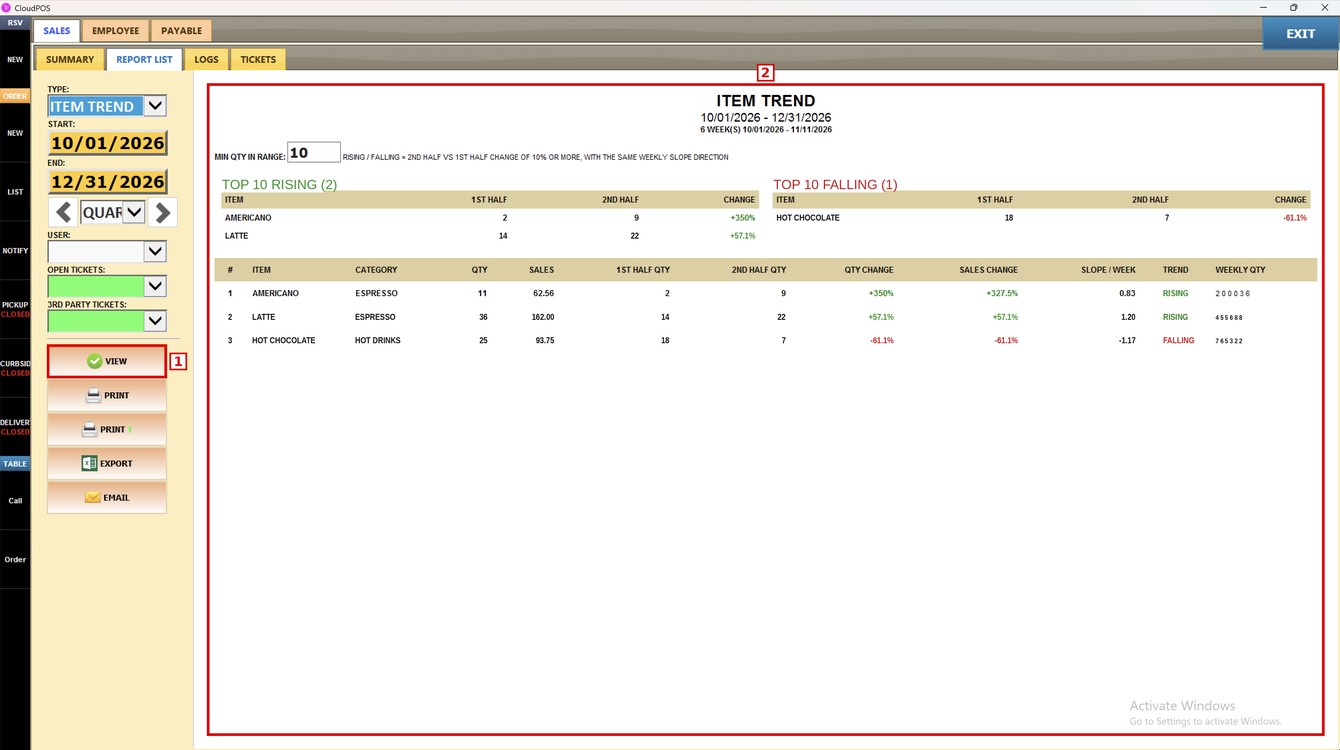
Press VIEW. The report is shown on the right, with the dates and the number of weeks in the report.
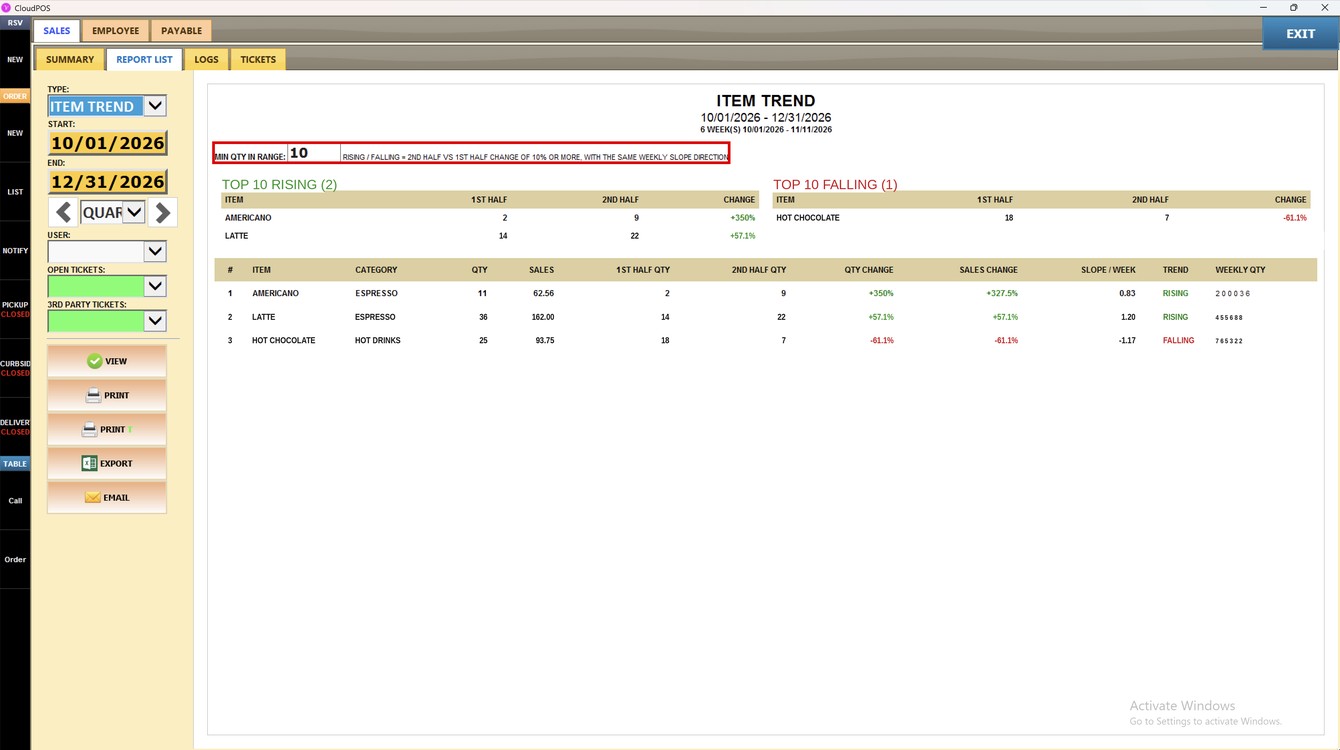
MIN QTY IN RANGE: Enter the minimum quantity an item must sell in the selected dates to be included in the report. An item is RISING or FALLING when its sales change 10% or more between the first and the second half of the dates.
Top 10 Rising and Falling:
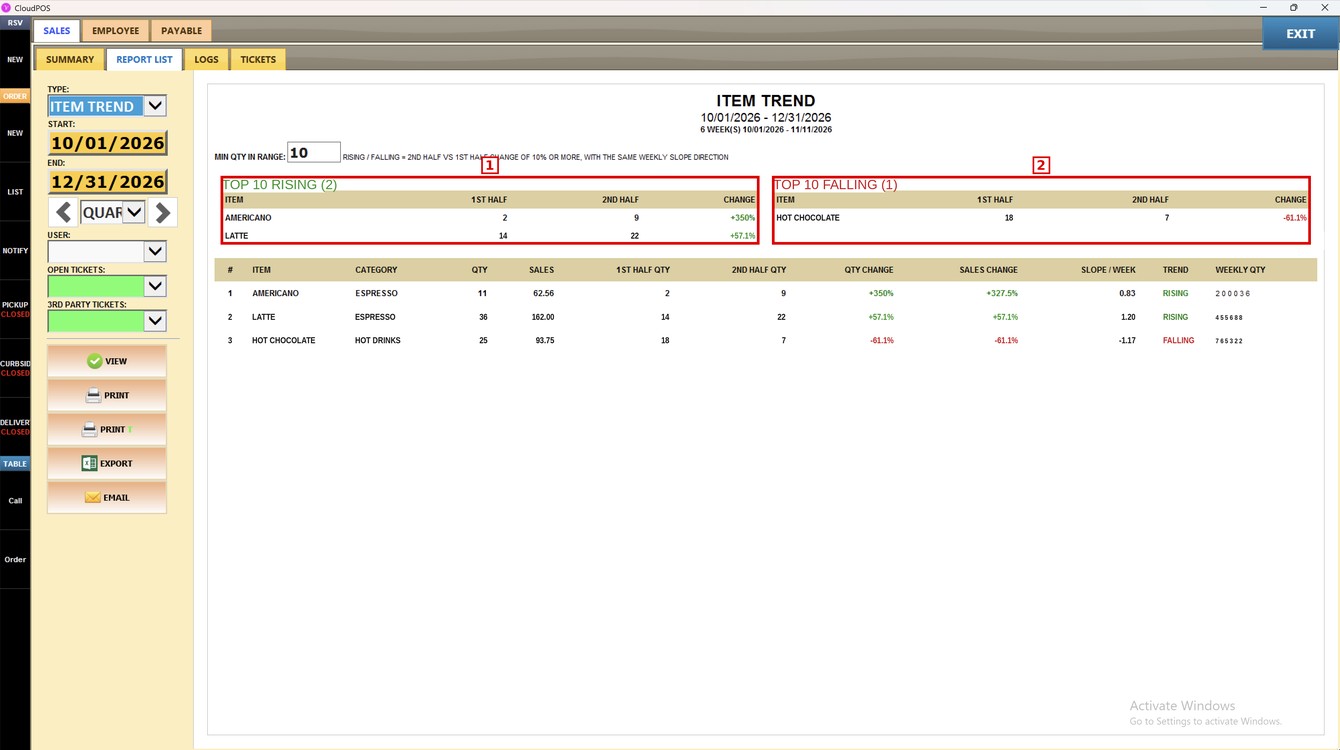
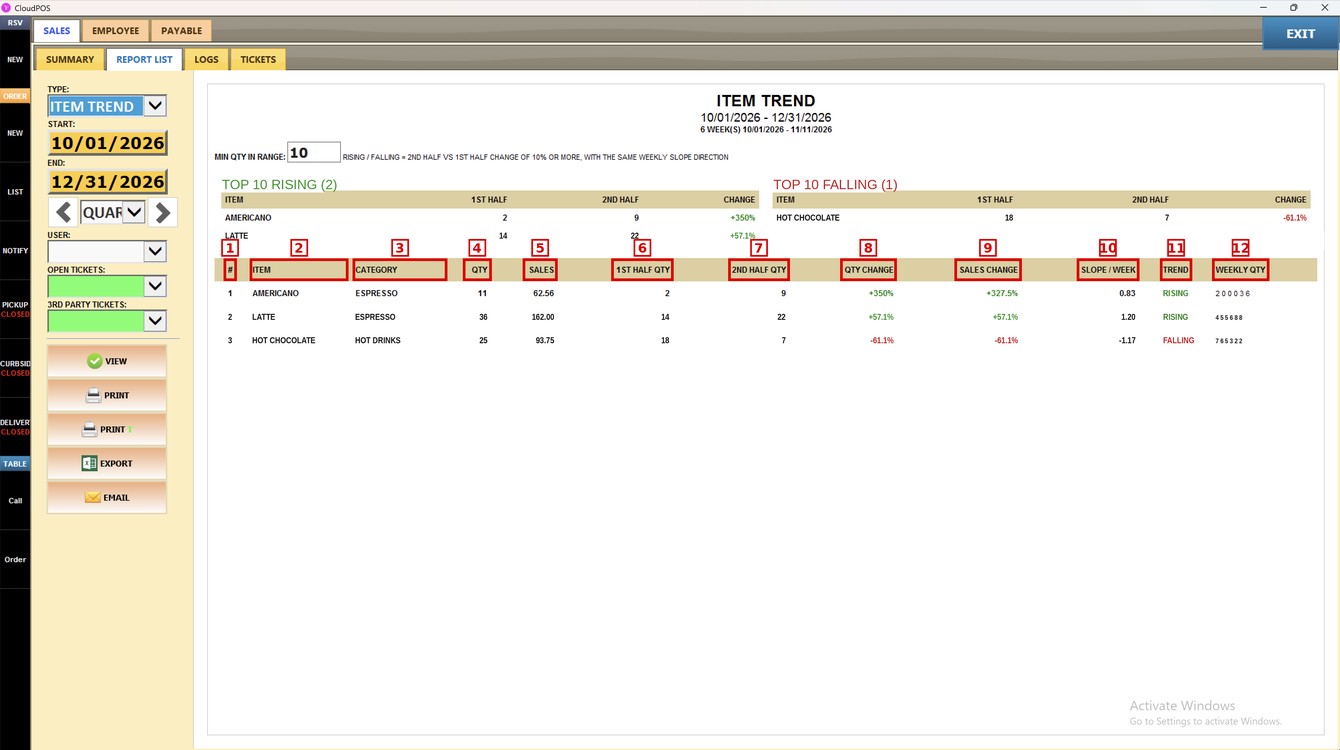
1. TOP 10 RISING: The items with the biggest increase in sales, with the quantity sold in the first half, in the second half and the change.
2. TOP 10 FALLING: The items with the biggest decrease in sales.
Report Details:
Each row is one menu item. Each column shows:
1. #: Position of the item in the report.
2. ITEM: Name of the menu item.
3. CATEGORY: Category of the item.
4. QTY: Quantity sold in the selected dates.
5. SALES: Sales amount of the item in the selected dates.
6. 1ST HALF QTY: Quantity sold in the first half of the dates.
7. 2ND HALF QTY: Quantity sold in the second half of the dates.
8. QTY CHANGE: Change in quantity between the two halves.
9. SALES CHANGE: Change in sales amount between the two halves.
10. SLOPE / WEEK: Average change in quantity from one week to the next.
11. TREND: RISING or FALLING.
12. WEEKLY QTY: Quantity sold in each week of the report, from the first to the last week.
Print and Export:
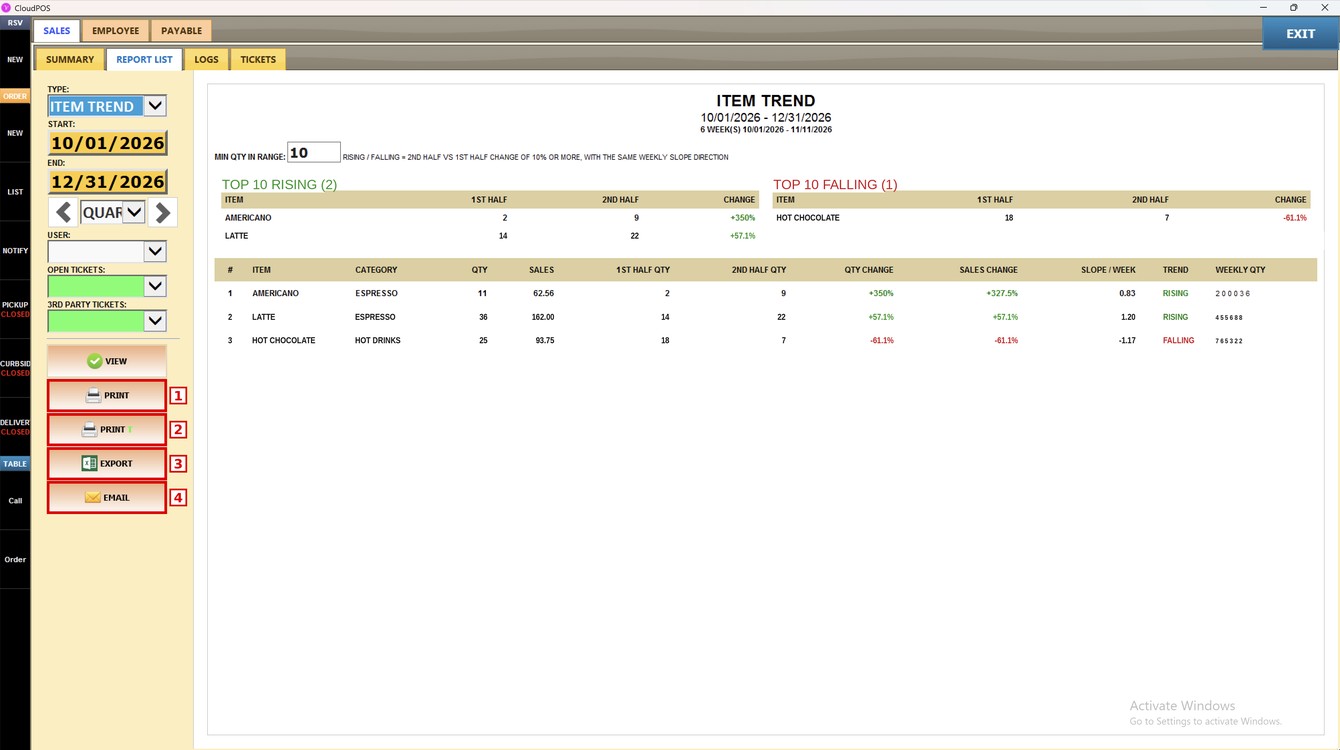
1. PRINT: Prints the report.
2. PRINT T: Prints the report on the ticket printer.
3. EXPORT: Exports the report to an Excel file.
4. EMAIL: Sends the report by email.
To learn about the items that are not selling, please refer to the Slow / Dead Items Guide.