Overview
This section gives you an overview of the store’s sales performance. These reports help you review daily and period totals, track transactions, guests, payments, and taxes, and identify sales trends so you can make informed decisions about your business.
REPORTS> SALES
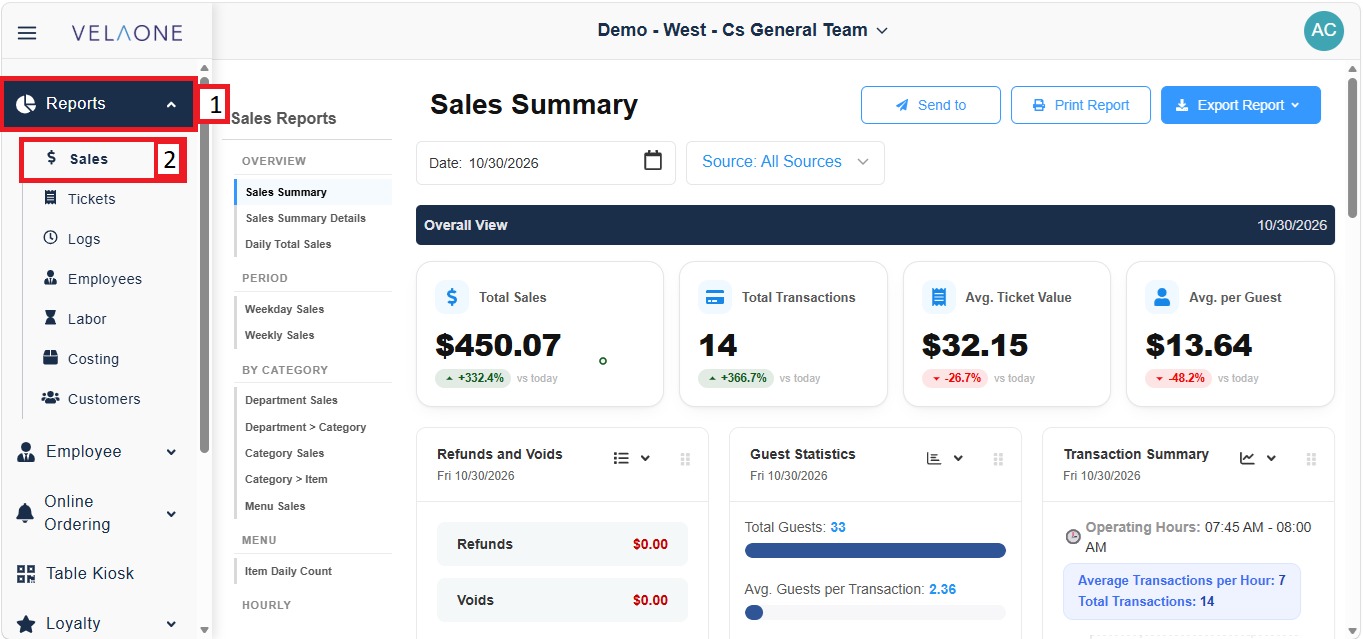
From the left menu, click REPORTS, then select SALES.
SALE SUMMARY
This section provides a visual overview of sales performance for the selected date through charts and graphical representations, making it easy to review key sales figures and identify trends at a glance.
FILTERS
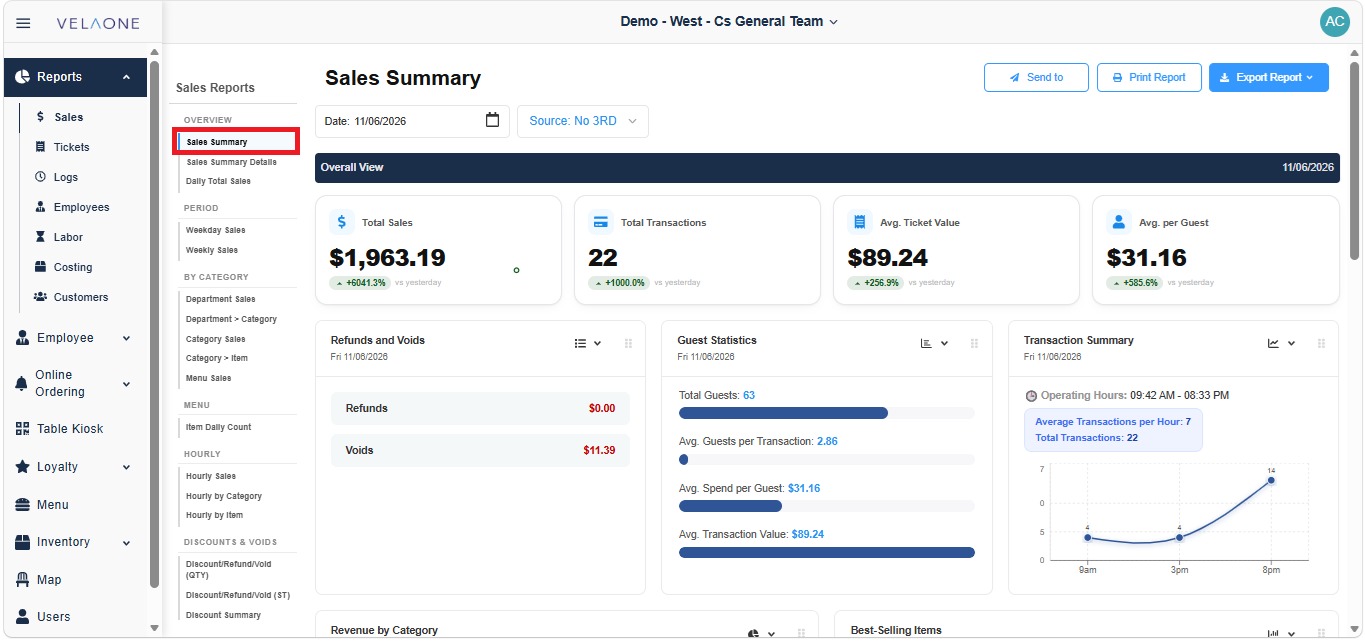
The filters and report buttons are at the top of the report.
1. DATE: sets the day or period the report covers.
Click the DATE field to open the calendar.
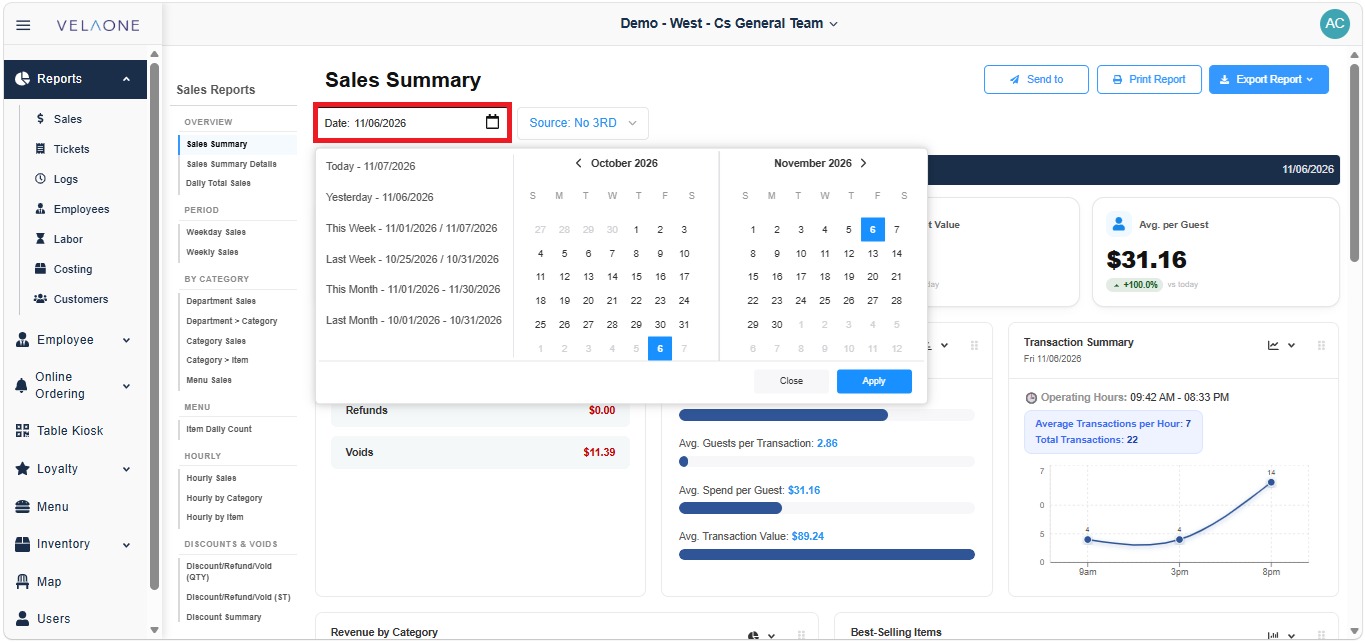
Select a preset period from the list on the left (TODAY, YESTERDAY, THIS WEEK, LAST WEEK, THIS MONTH or LAST MONTH), or click the dates directly on the calendars.
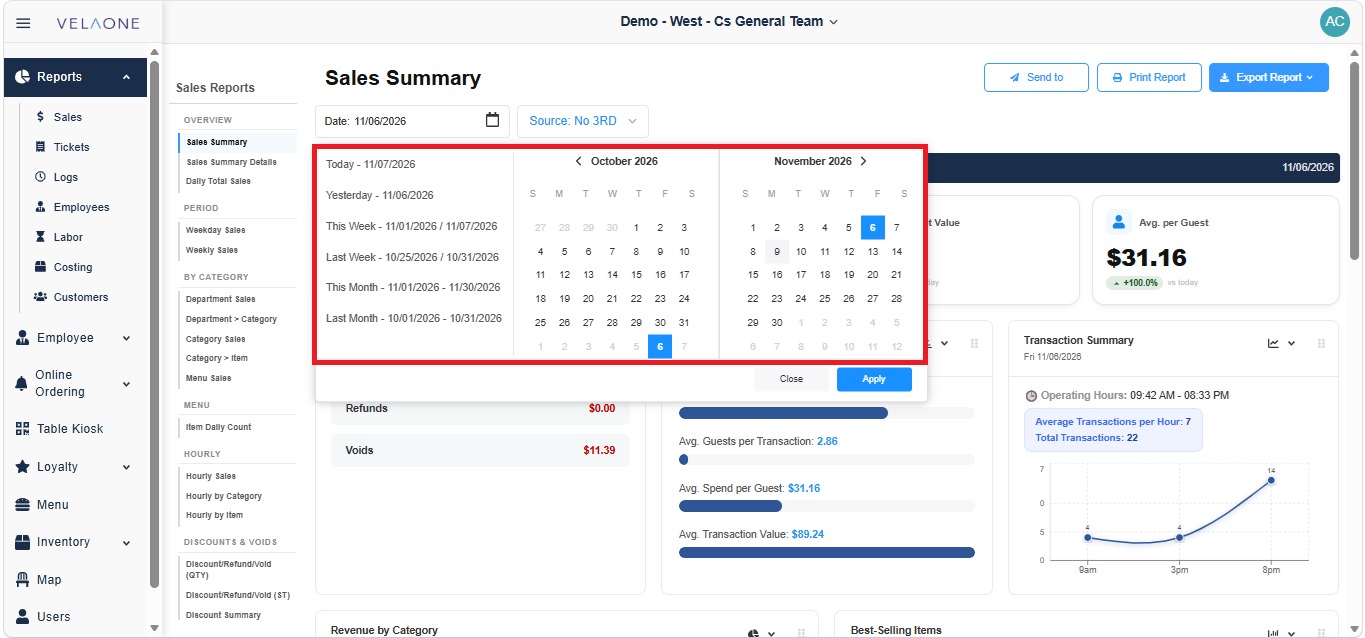
Use the arrows next to the month names to move to earlier or later months.
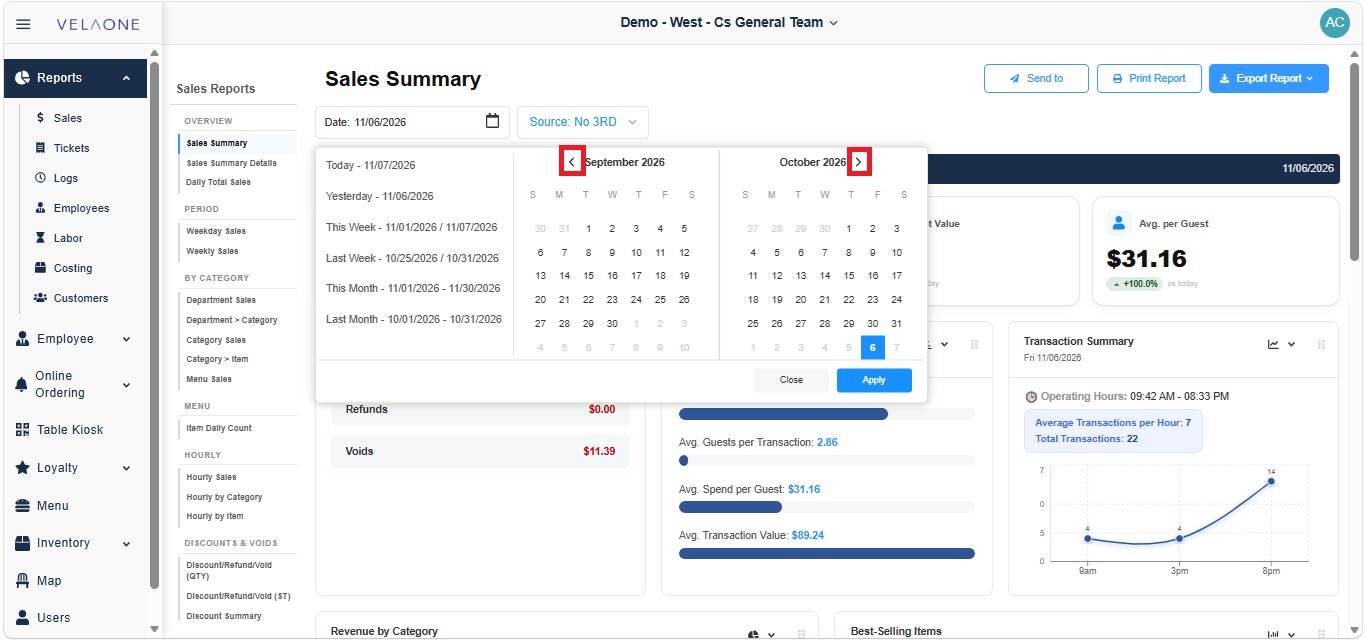
Click APPLY to load the report for the selected date.
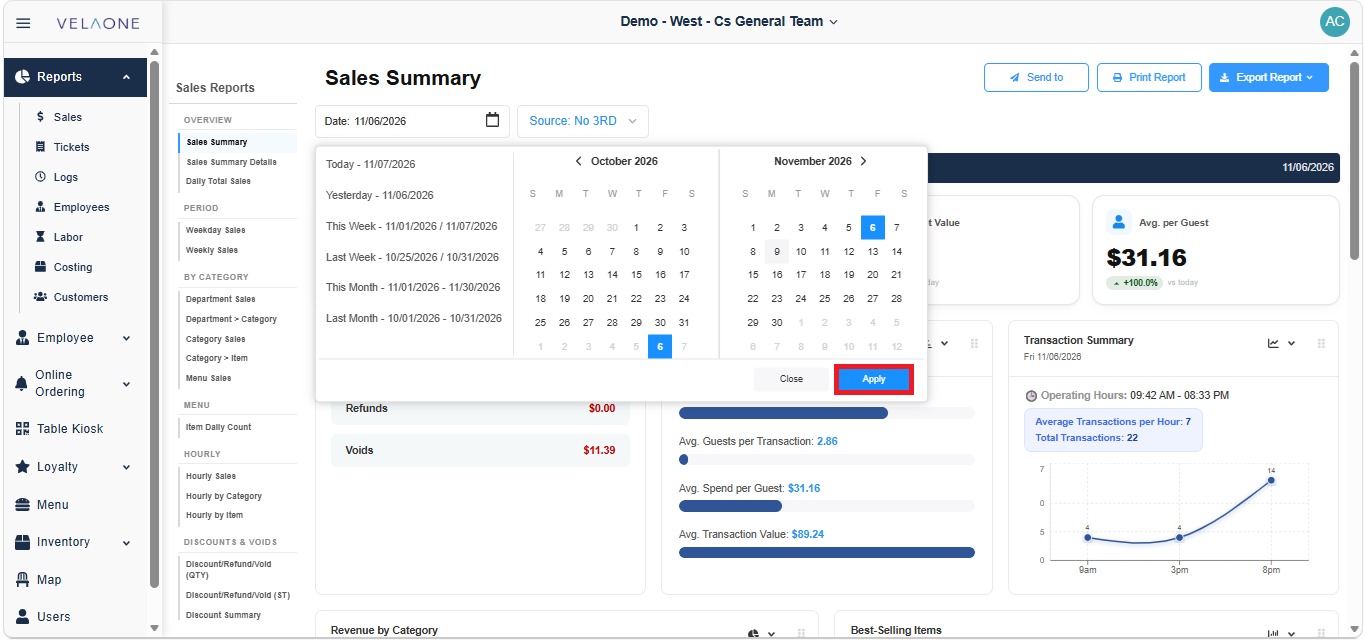
2. SOURCE: filters the sales by where they came from. NO 3RD leaves out third-party sales, ONLY 3RD shows only third-party sales, and ALL SOURCES includes both.
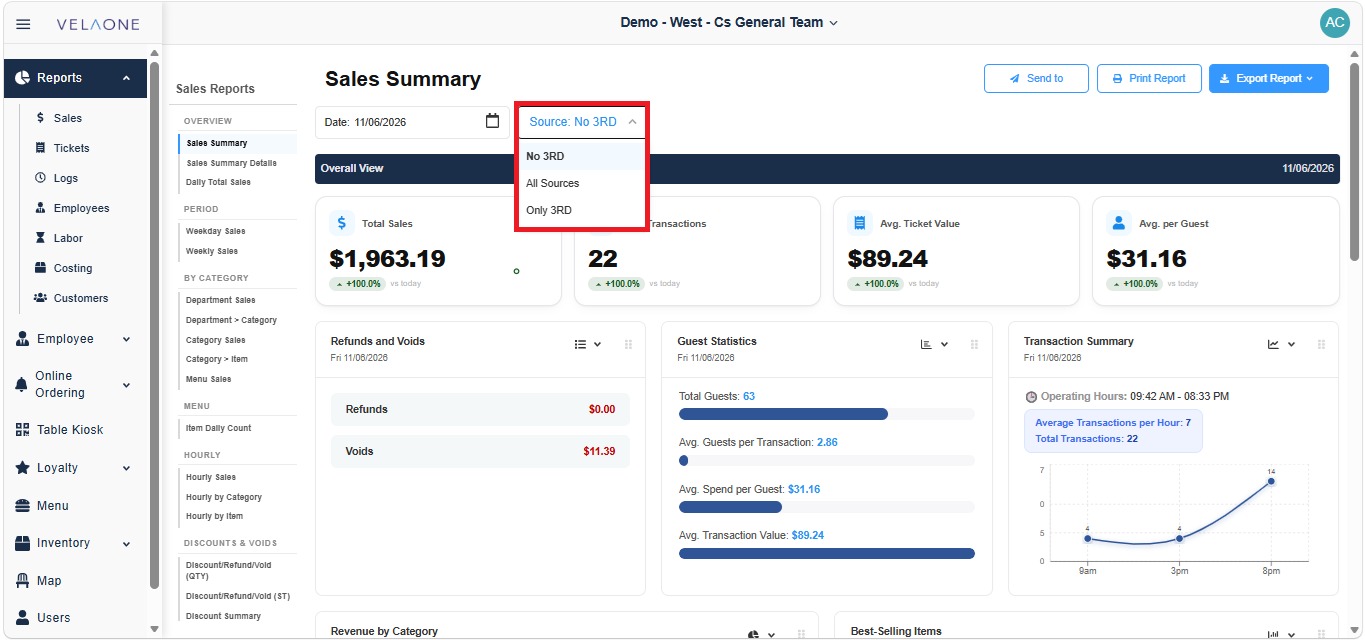
Export Options
SEND TO: sends the report to a recipient.
PRINT REPORT: prints the report as it is displayed.
EXPORT REPORT: downloads the report. Click EXPORT REPORT, then select CSV or EXCEL.
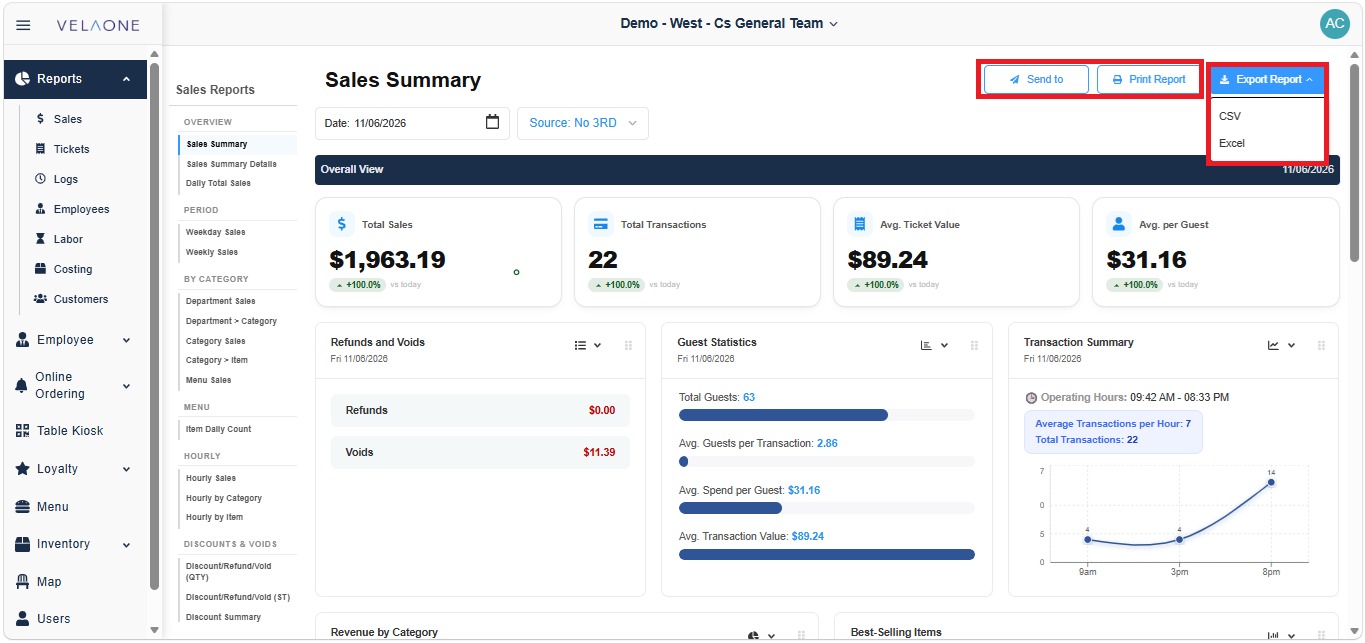
Overall View
The summary cards at the top show Total Sales, Total Transactions, Avg. Ticket Value and Avg. per Guest for the selected date. Each card includes a percentage badge, green for an increase and red for a decrease, that compares the value with another day.
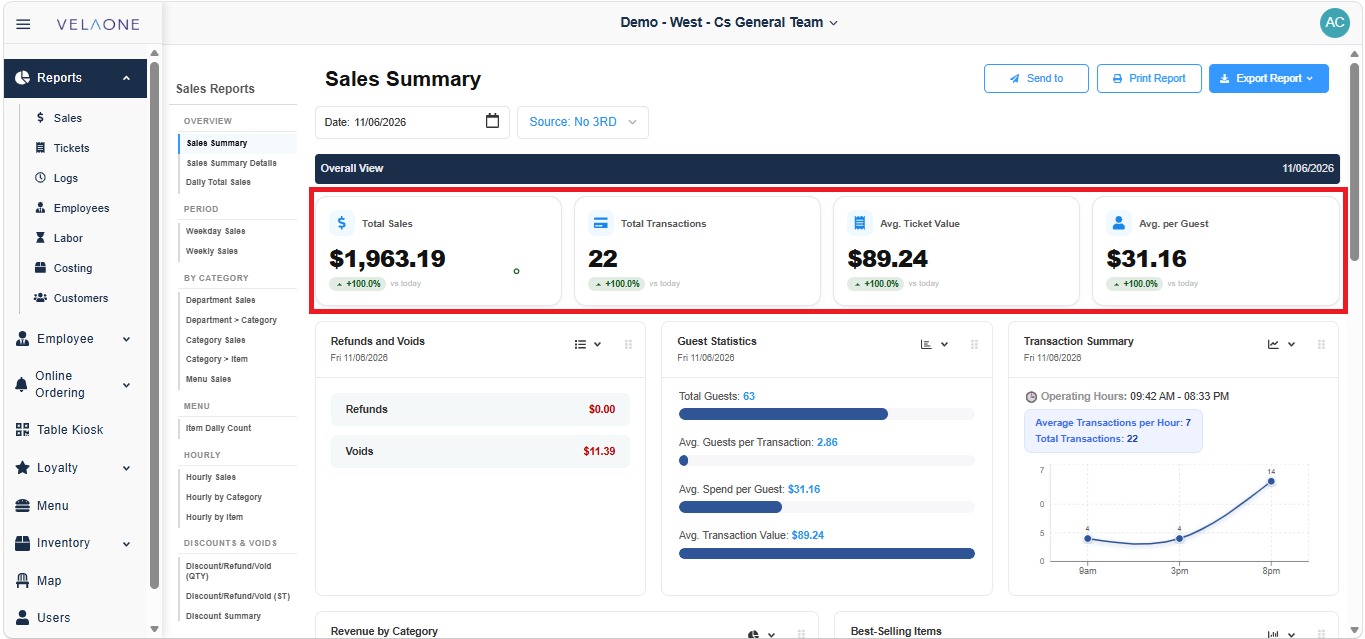
Most panels below the cards have a view dropdown in their top-right corner. Click it to switch how the panel displays its data, for example as a pie chart, bar chart, stats, list or table. The available views change from panel to panel.
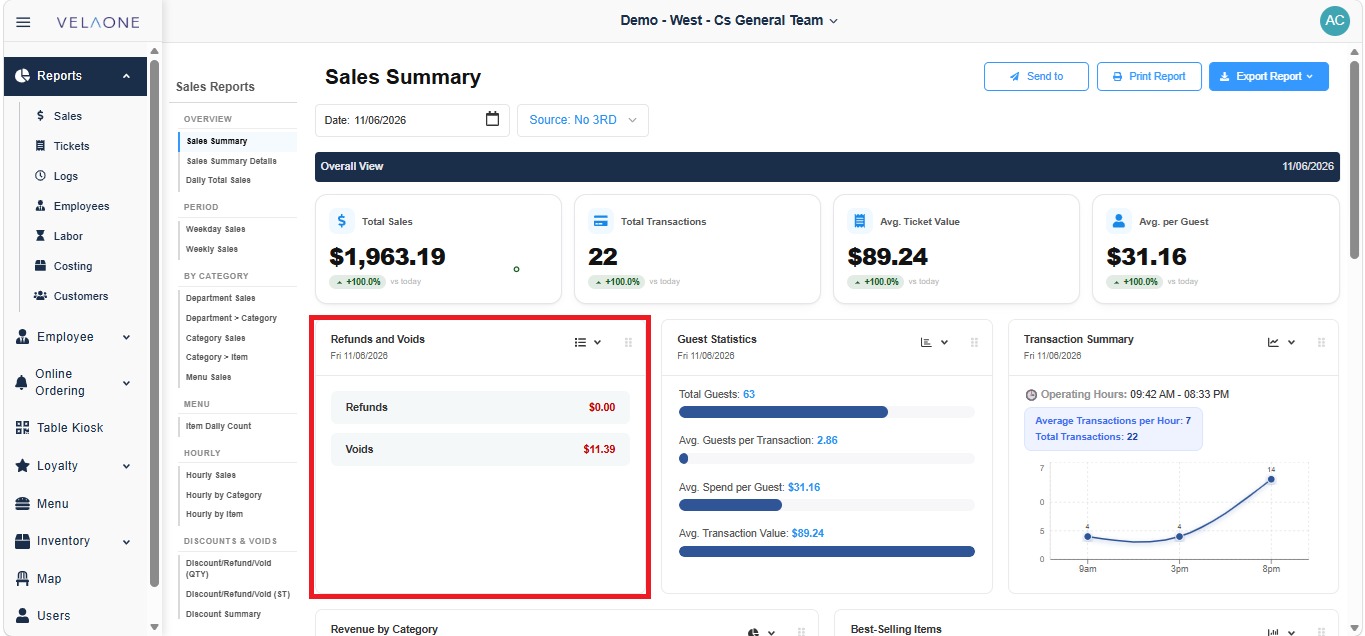
Refunds and Voids: shows the total amount of refunds and voids for the selected date. Its data can be displayed as a list or a table.
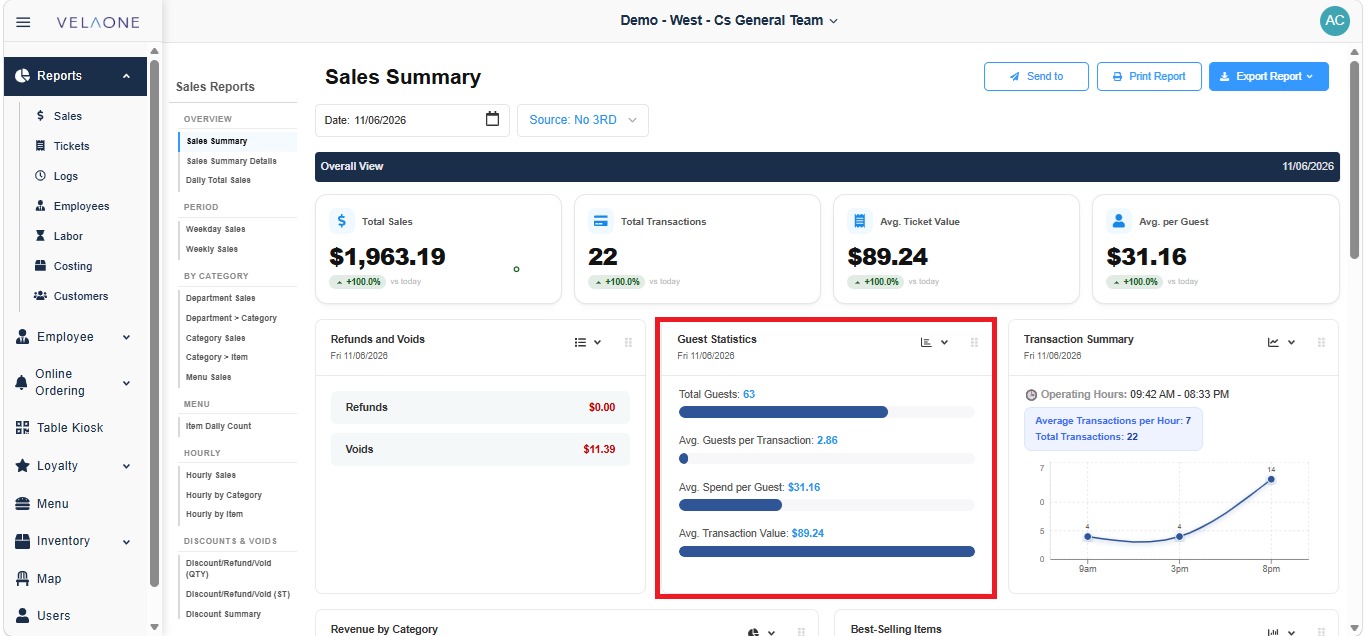
Guest Statistics: shows the total number of guests, the average number of guests per transaction, the average spend per guest and the average transaction value.
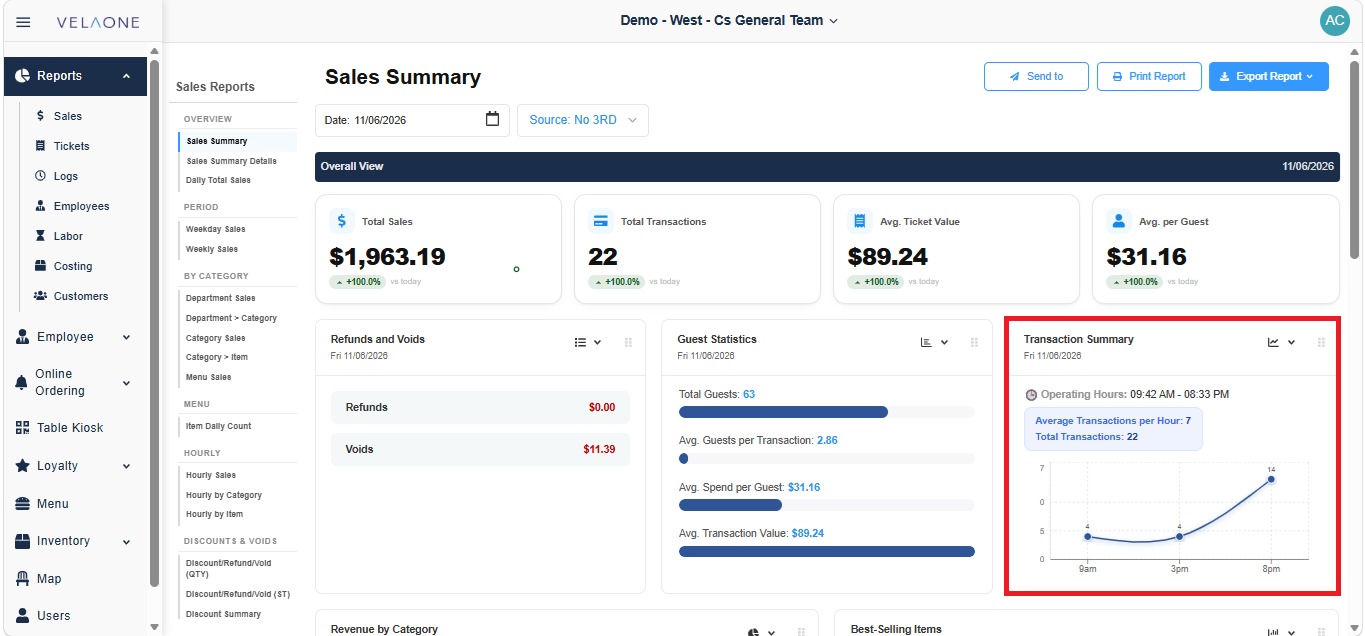
Transaction Summary: shows the store's operating hours, the average number of transactions per hour and the total number of transactions. The line chart shows how transactions are distributed across the day, so busy hours are easy to spot.
Revenue by Category: shows the total revenue and how it is divided among the menu categories, with the amount for each category in the legend.
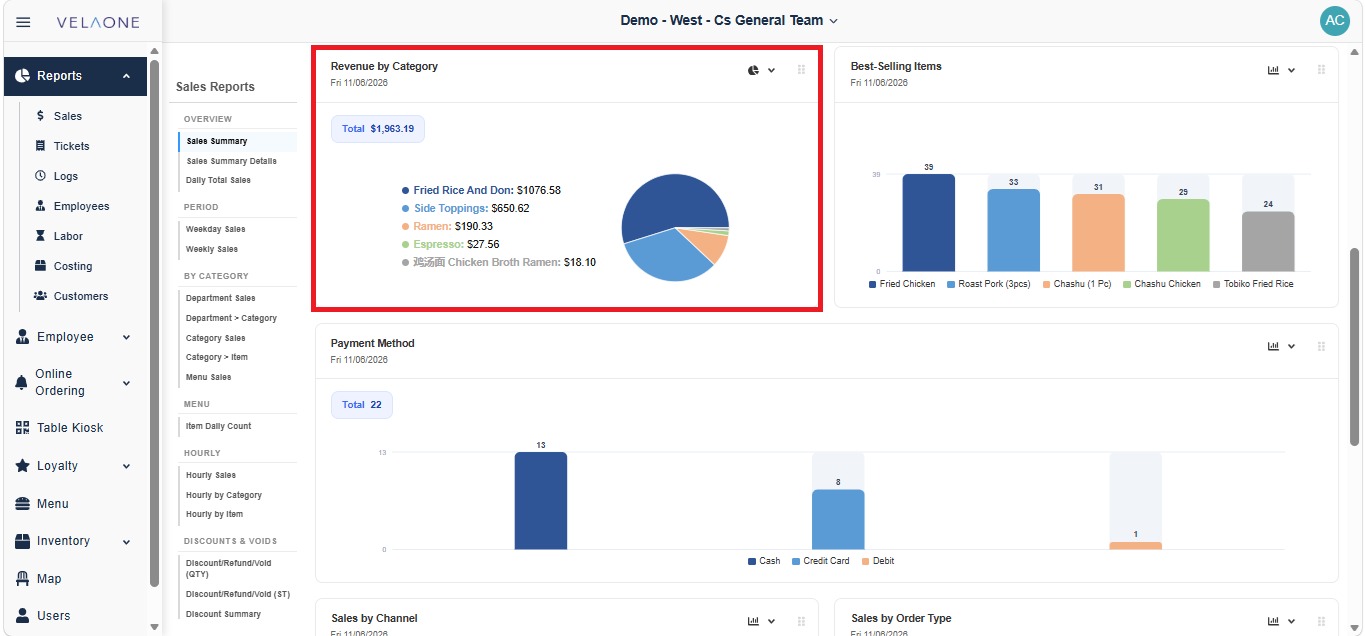
Best-Selling Items: shows the items sold most often and the quantity sold of each.
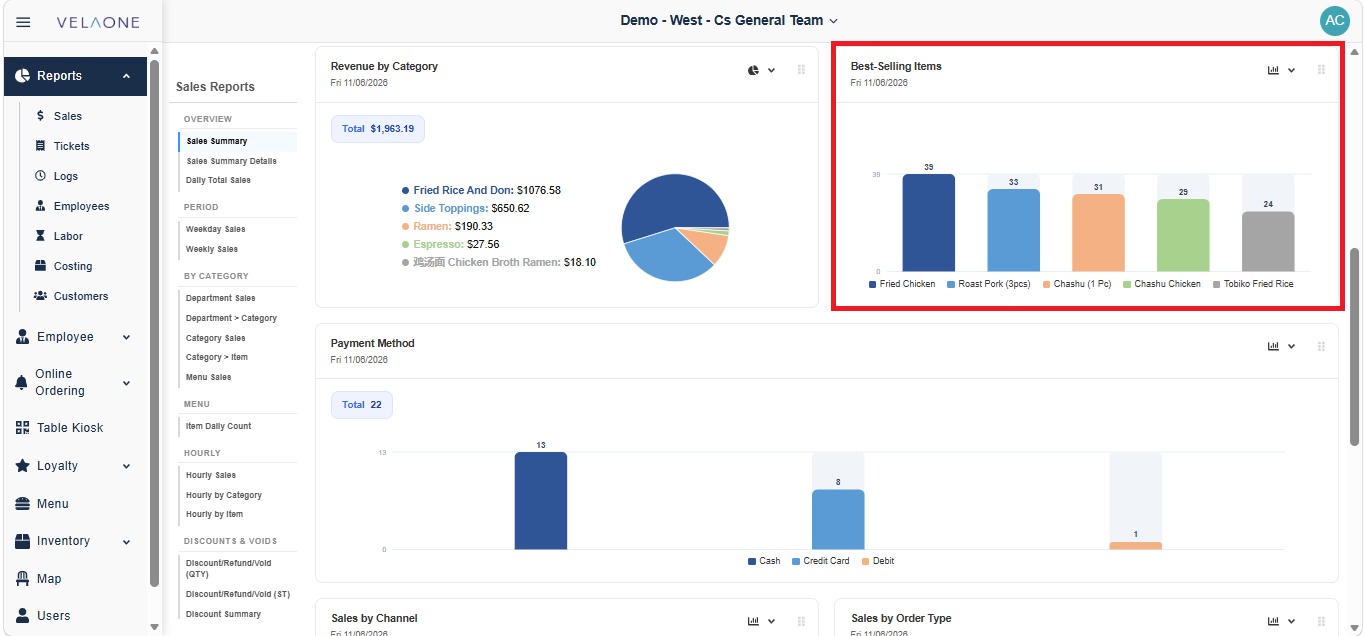
Payment Method: shows the total number of payments and how many were made with each payment method, such as Cash, Credit Card or Debit.
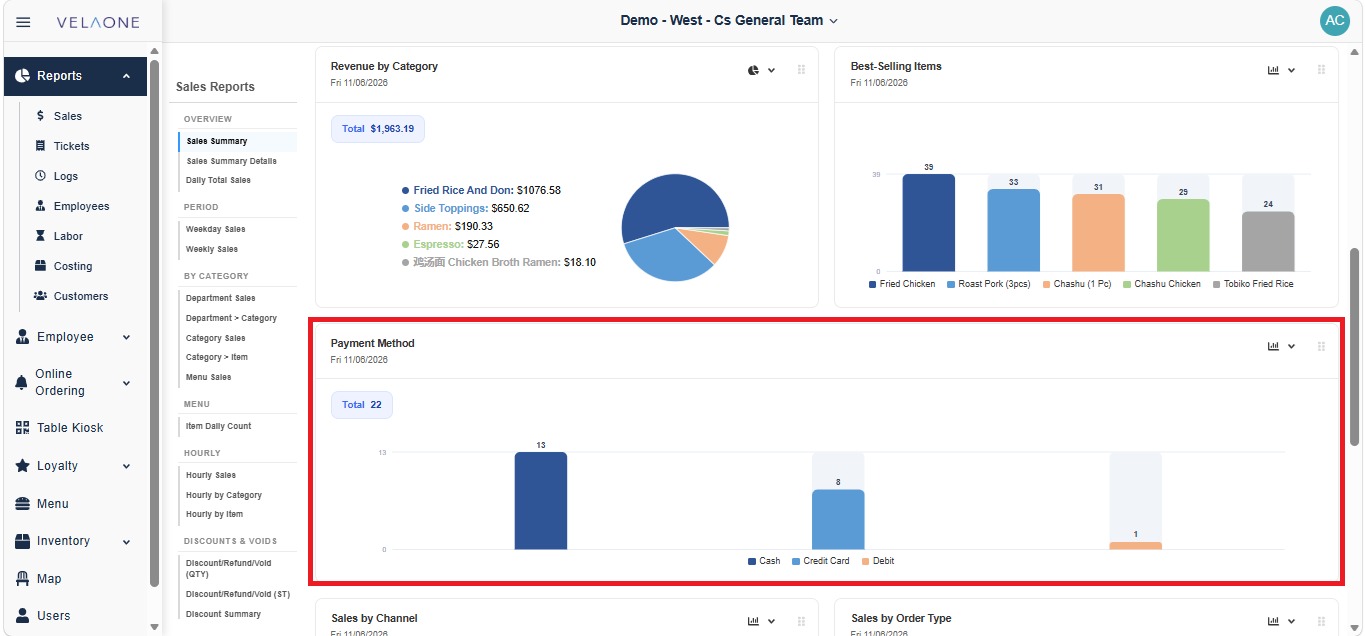
Sales by Channel: shows the total sales and the amount that came from each sales channel, such as Walk-in.
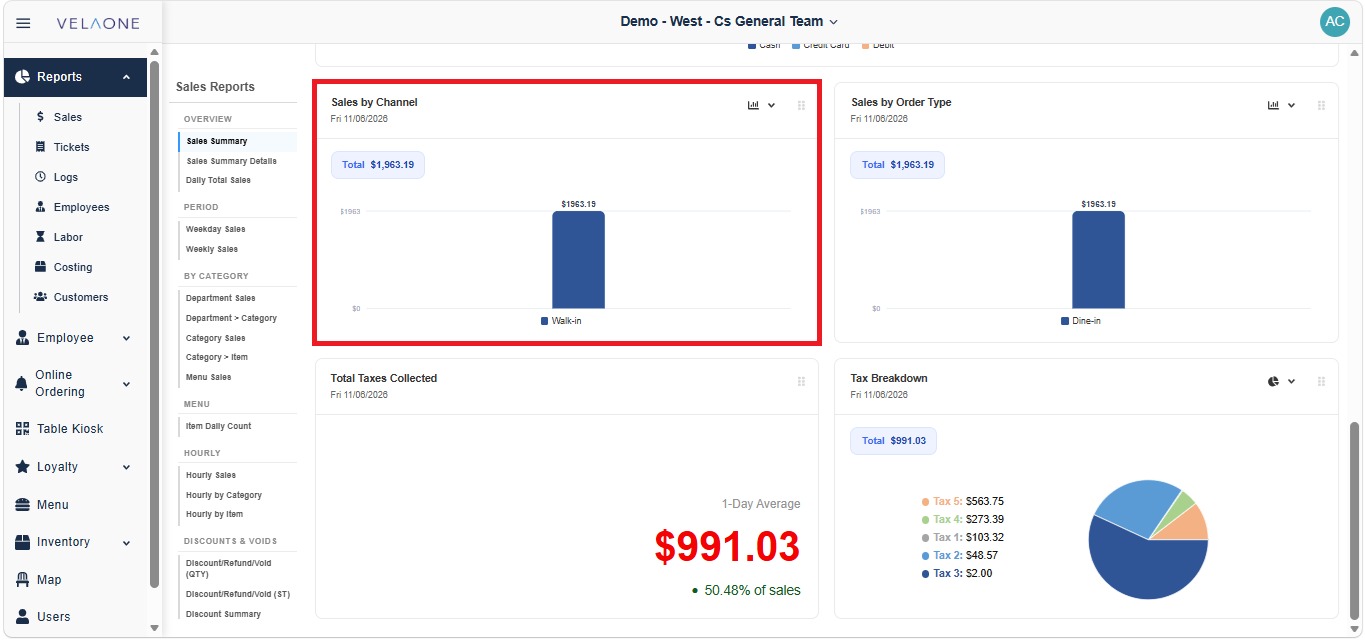
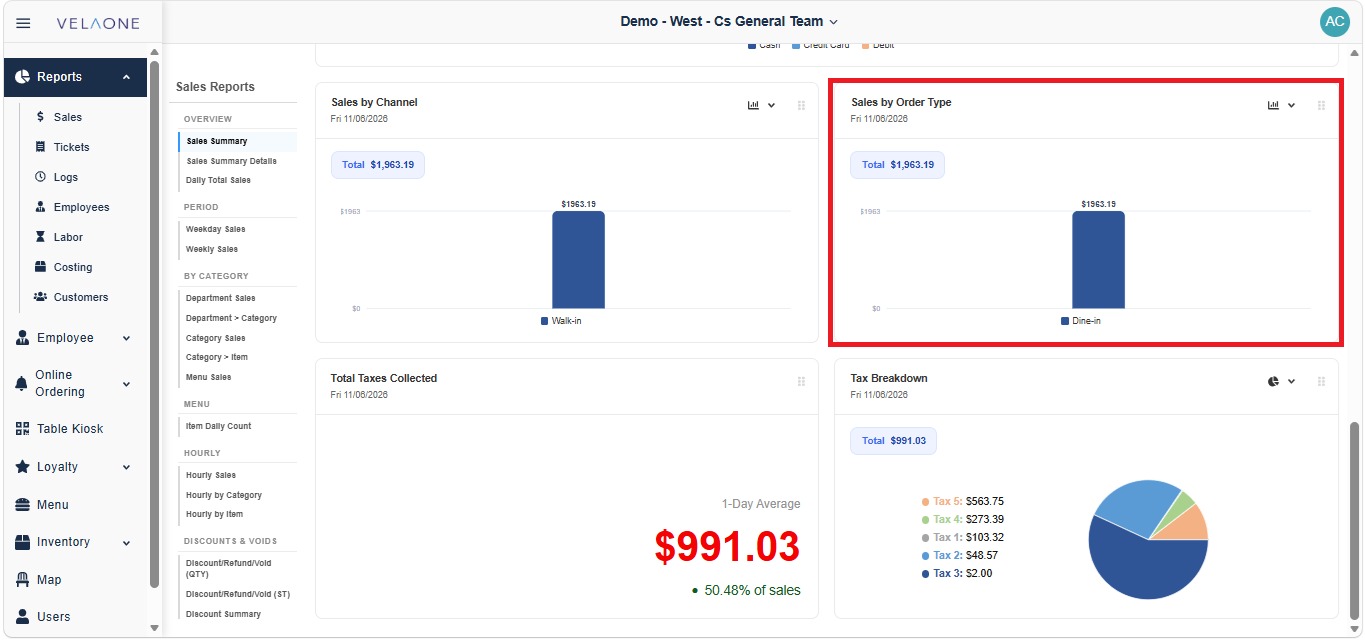
Sales by Order Type: shows the total sales and the amount for each type of transaction, such as Dine In.
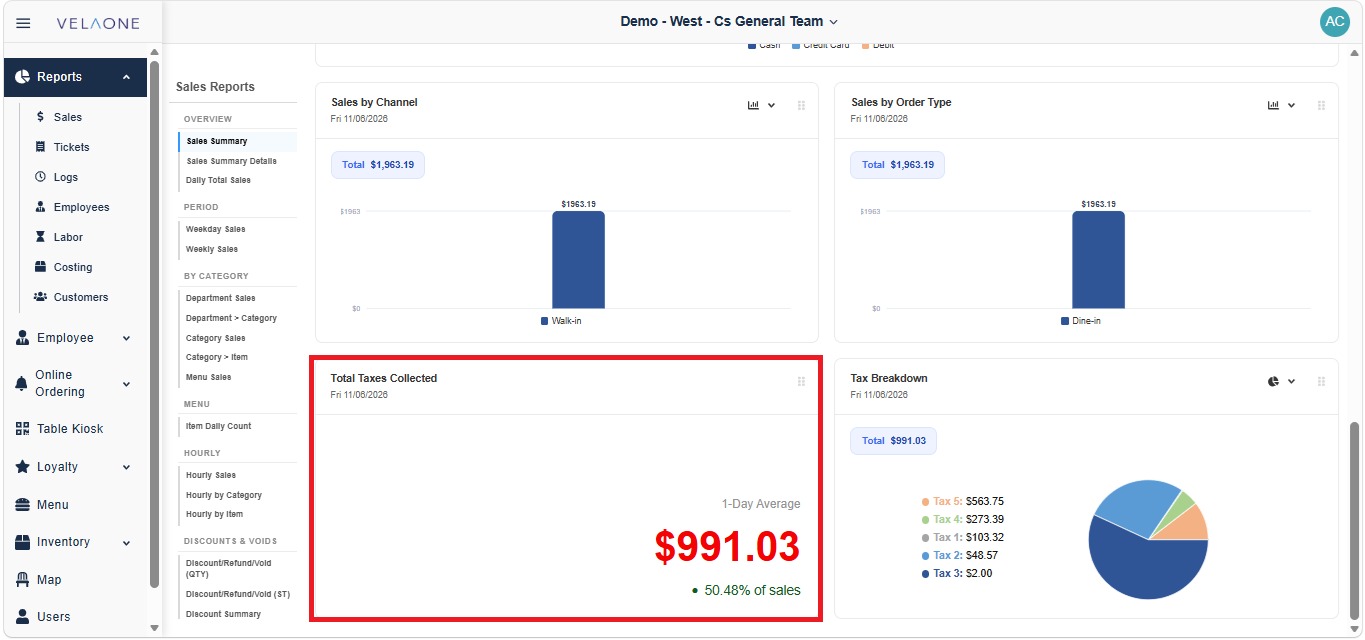
Total Taxes Collected: shows the daily average of taxes collected and the percentage of sales it represents.
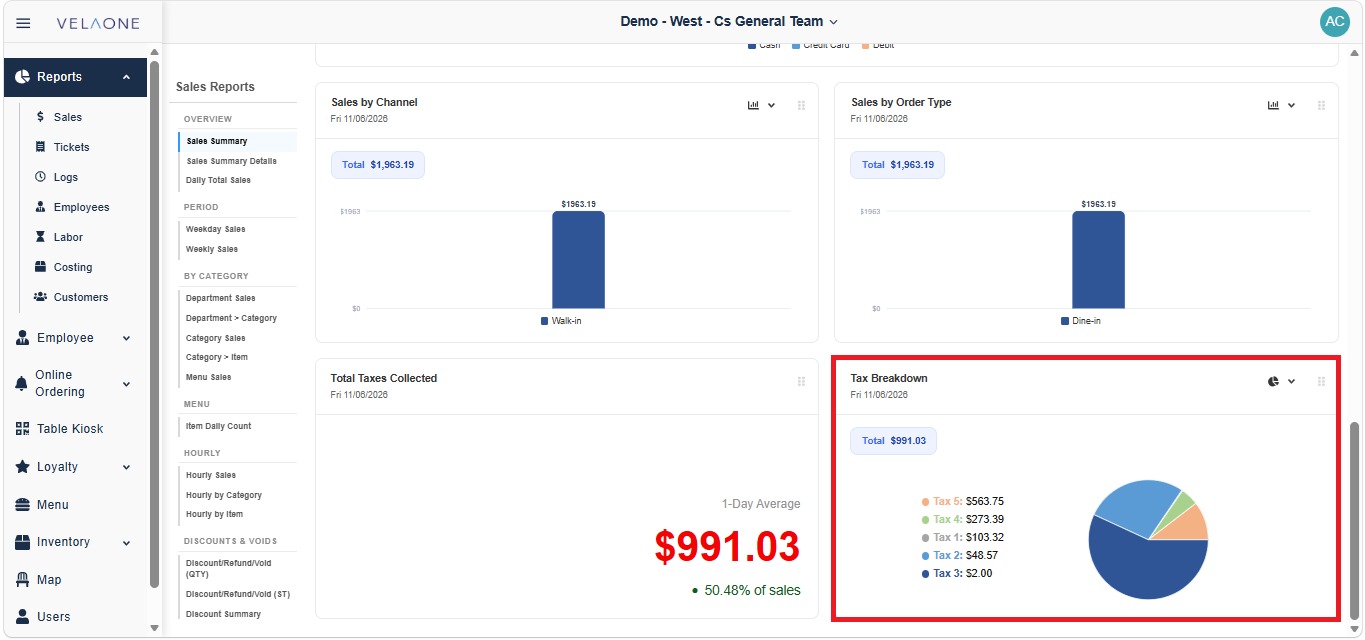
Tax Breakdown: shows the total taxes collected and the amount for each tax configured in the store.
Sales Summary Details
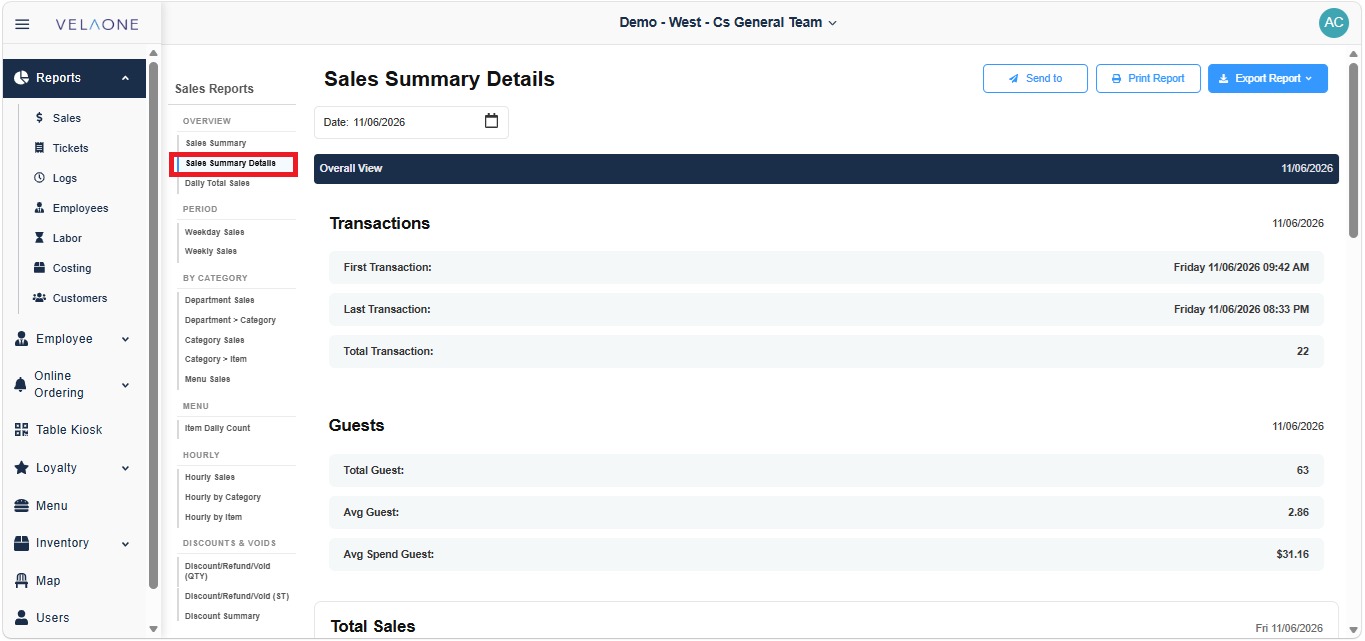
This report shows the same information as the Sales Summary, but in more detail. It breaks down the day’s transactions, guests, and total sales, so you can review the first and last transaction times, the number of transactions, the average guests per transaction, and the average spend per guest.
Daily Total Sales
In the SALES REPORTS panel, under OVERVIEW, click DAILY TOTAL SALES.
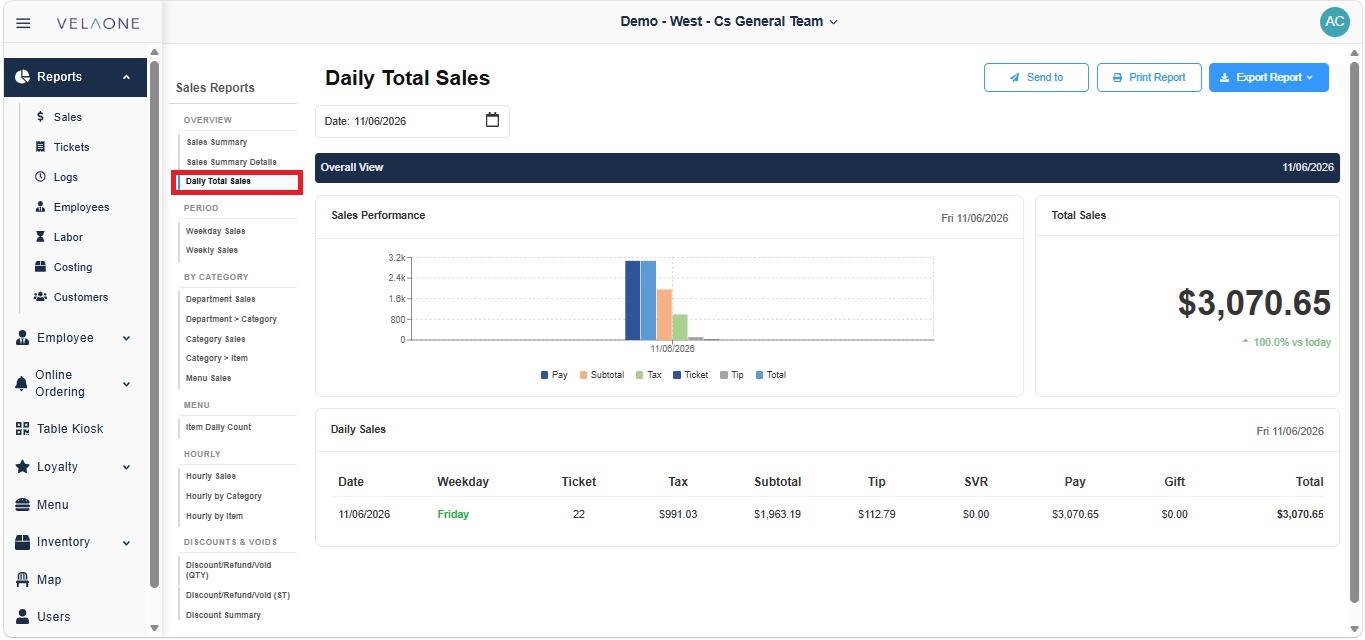
Sales Performance: shows a bar chart that compares Pay, Subtotal, Tax, Ticket, Tip and Total for each day in the selected period.
Total Sales: shows the grand total for the period, including taxes and tips, with a percentage comparison.
Daily Sales: shows a table with one row per day and these columns: Date, Weekday, Ticket, Tax, Subtotal, Tip, SVR, Pay, Gift and Total.