By Category
This section contains the online sales reports that break down the store's sales by category.
REPORTS> SALES> BY CATEGORY
From the left menu, click REPORTS, then select SALES.
In the SALES REPORTS panel, go to the BY CATEGORY section and click the report you want to open.
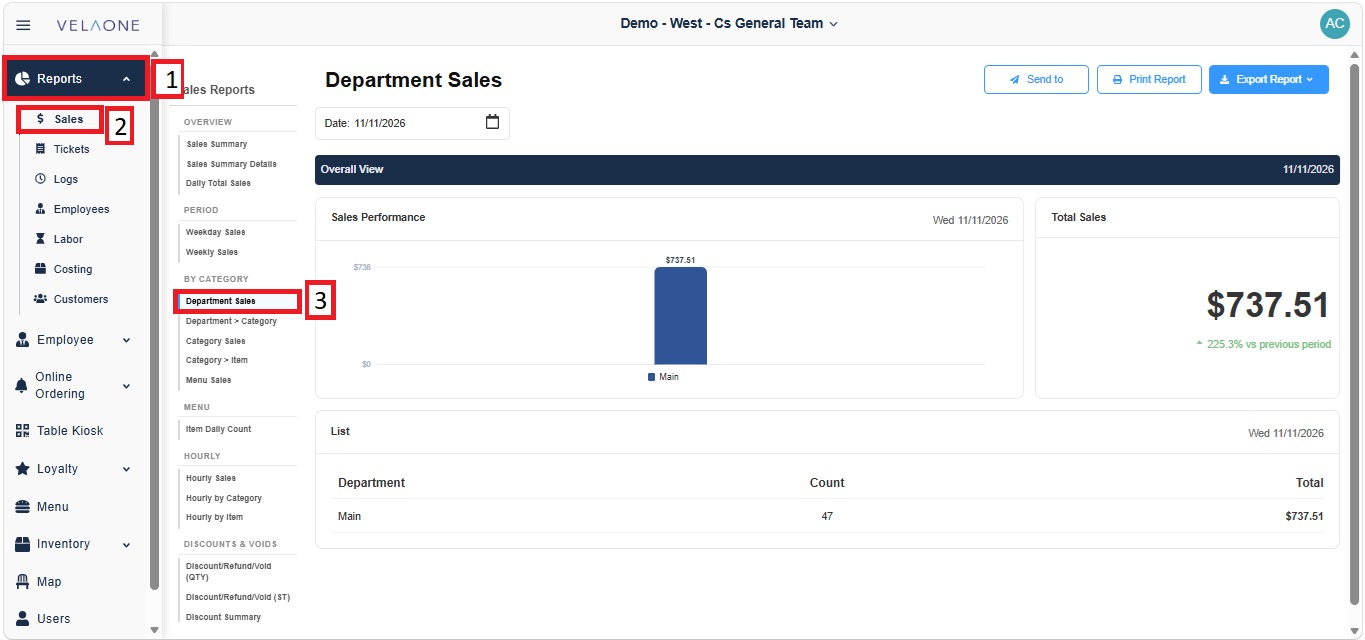
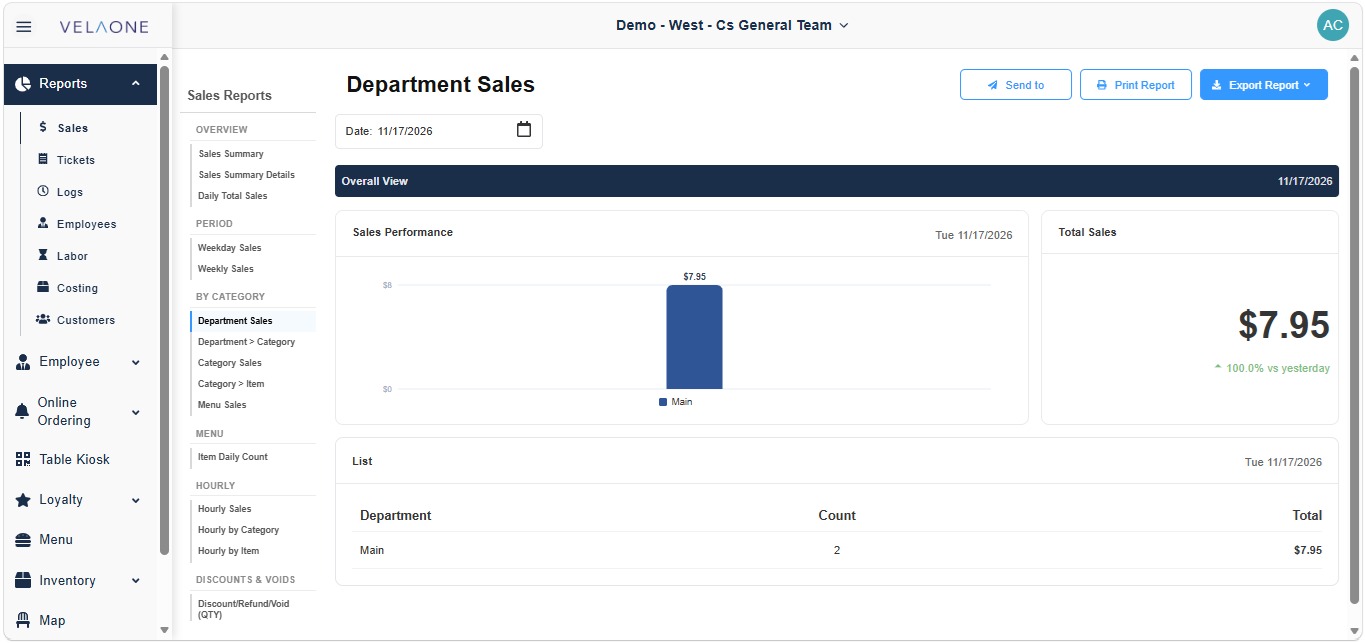
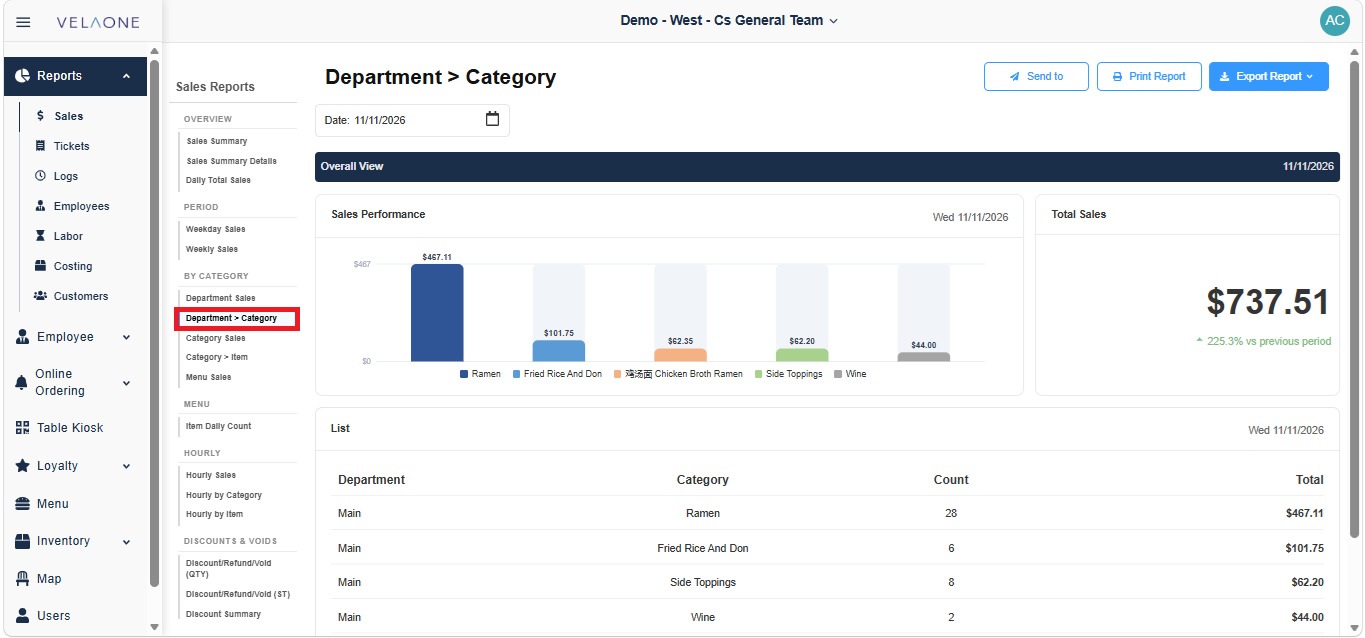
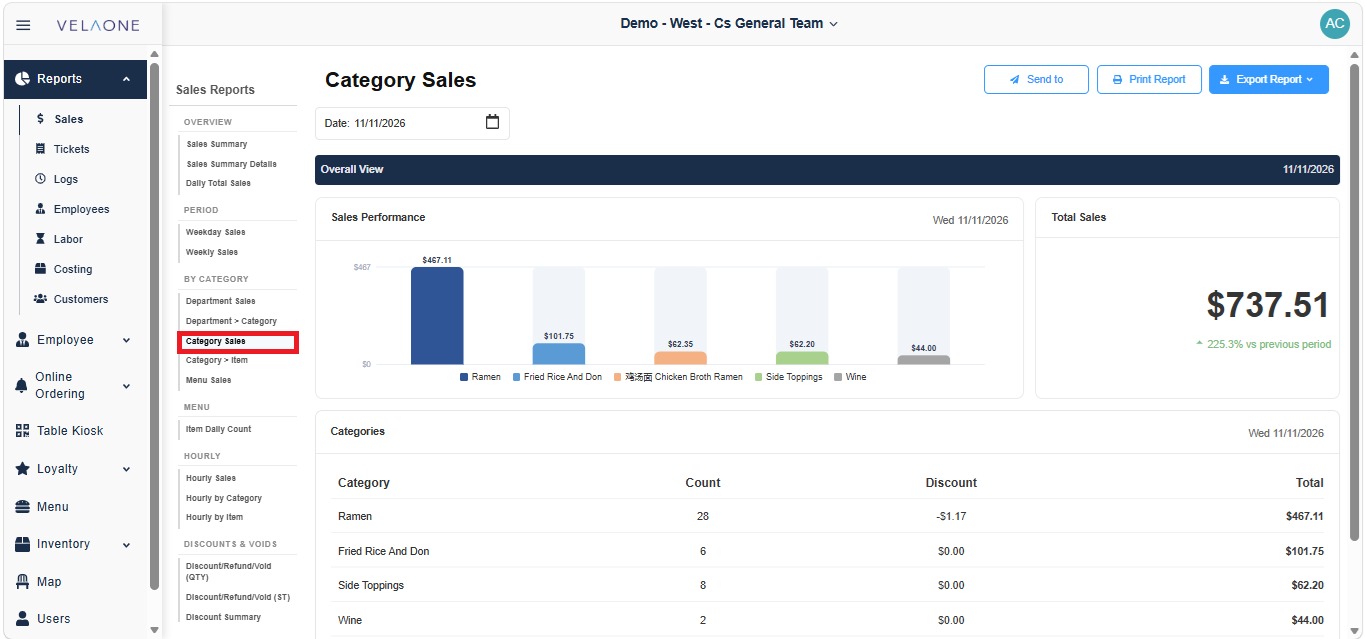
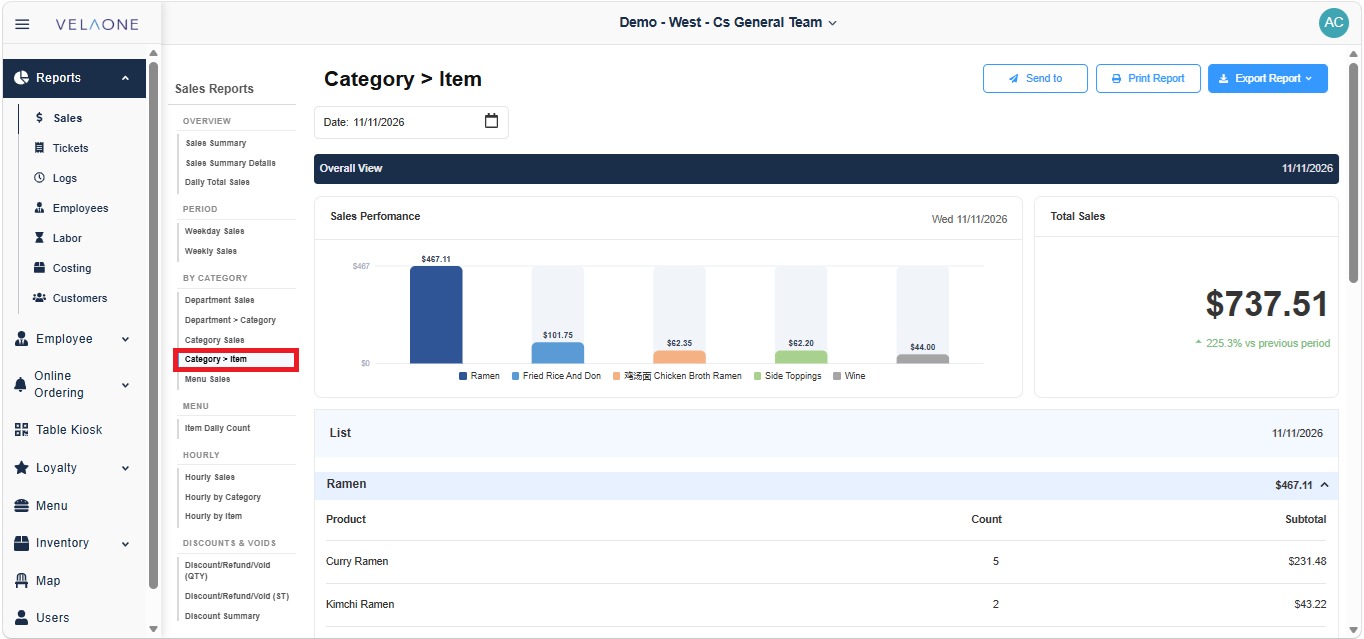
Each report opens with an OVERALL VIEW banner showing the selected date. Below it, the SALES PERFORMANCE card shows a bar chart of the sales for that date. The TOTAL SALES card shows the total amount sold and the percentage change compared with the previous period. A table at the bottom breaks the sales down by the grouping of the selected report.
FILTERS
The filters and report buttons are at the top of the report.
1. DATE: sets the day or period the report covers.
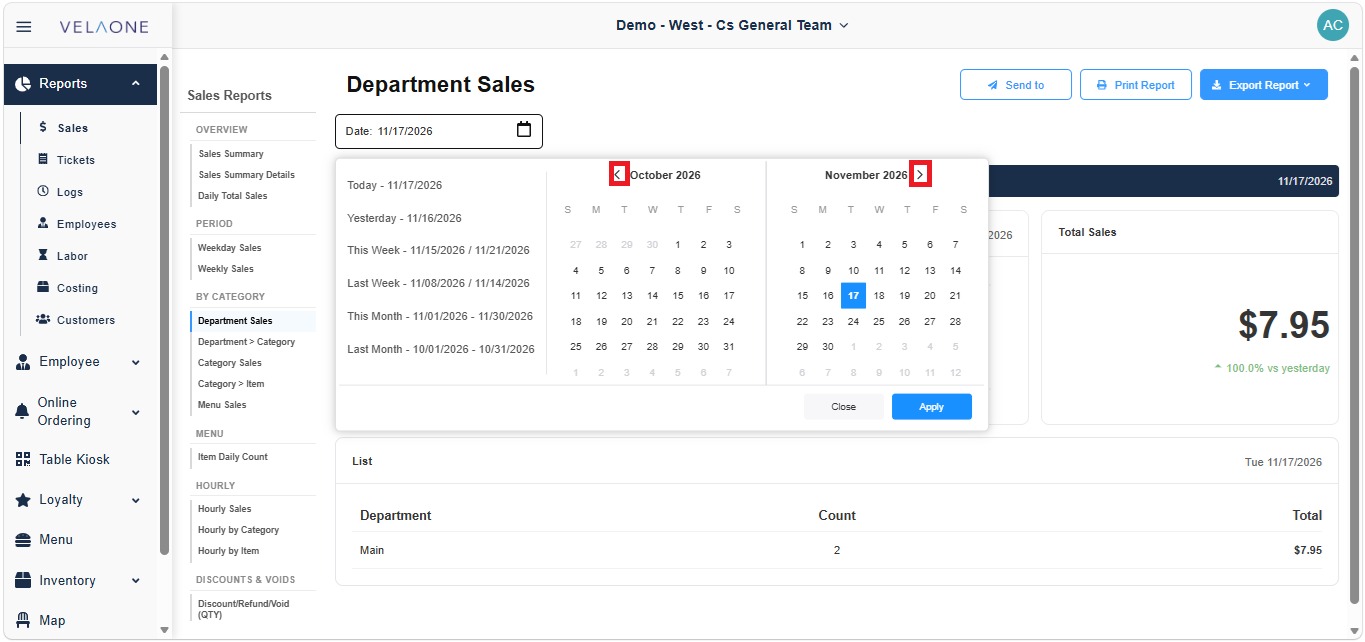
Click the DATE field to open the calendar.
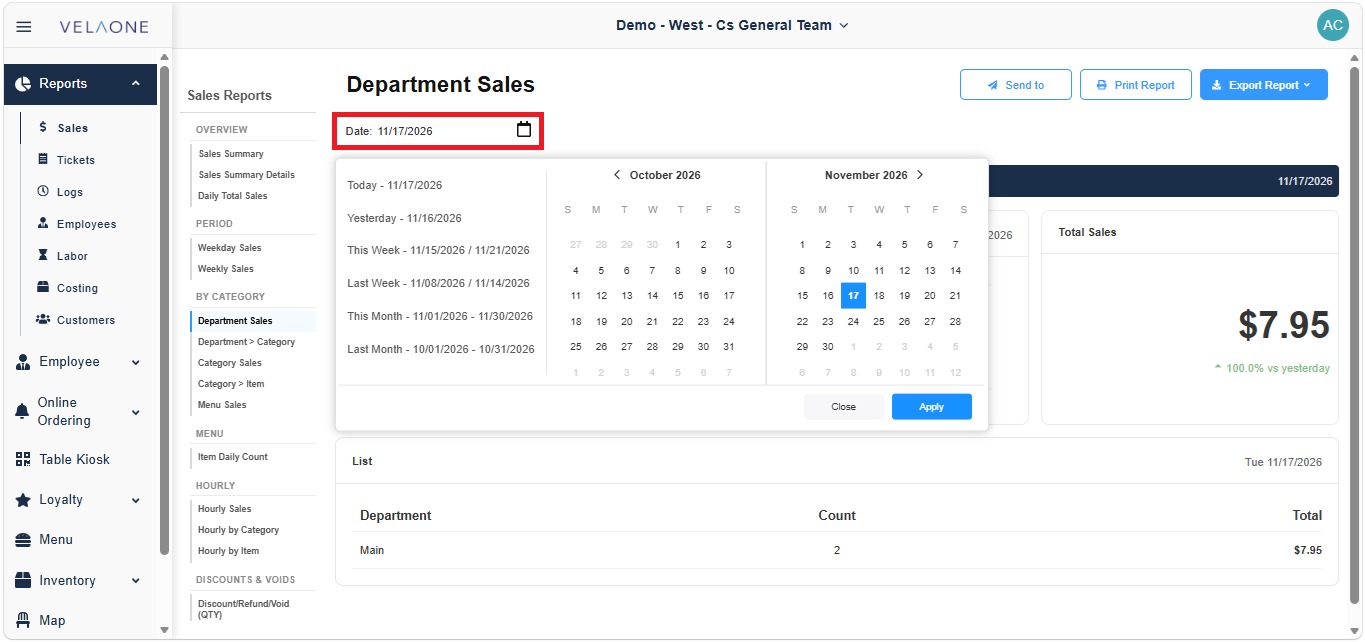
Select a preset period from the list on the left (TODAY, YESTERDAY, THIS WEEK, LAST WEEK, THIS MONTH or LAST MONTH), or click the dates directly on the calendars.
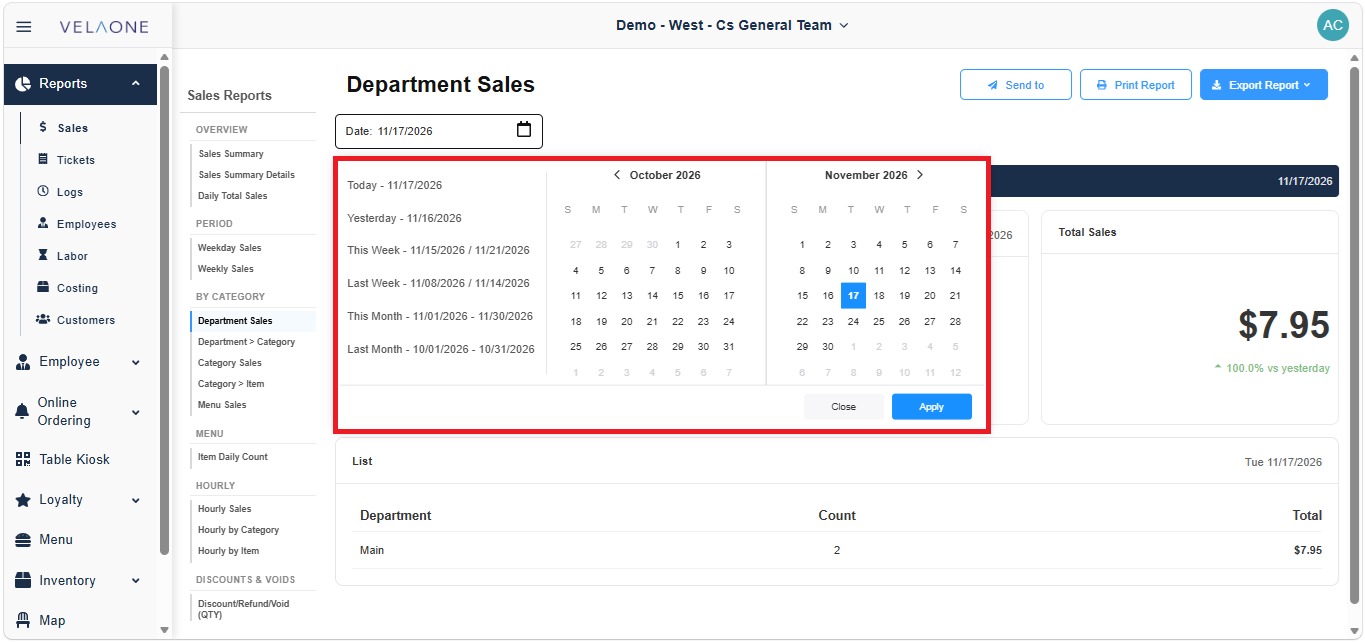
Use the arrows next to the month names to move to earlier or later months.
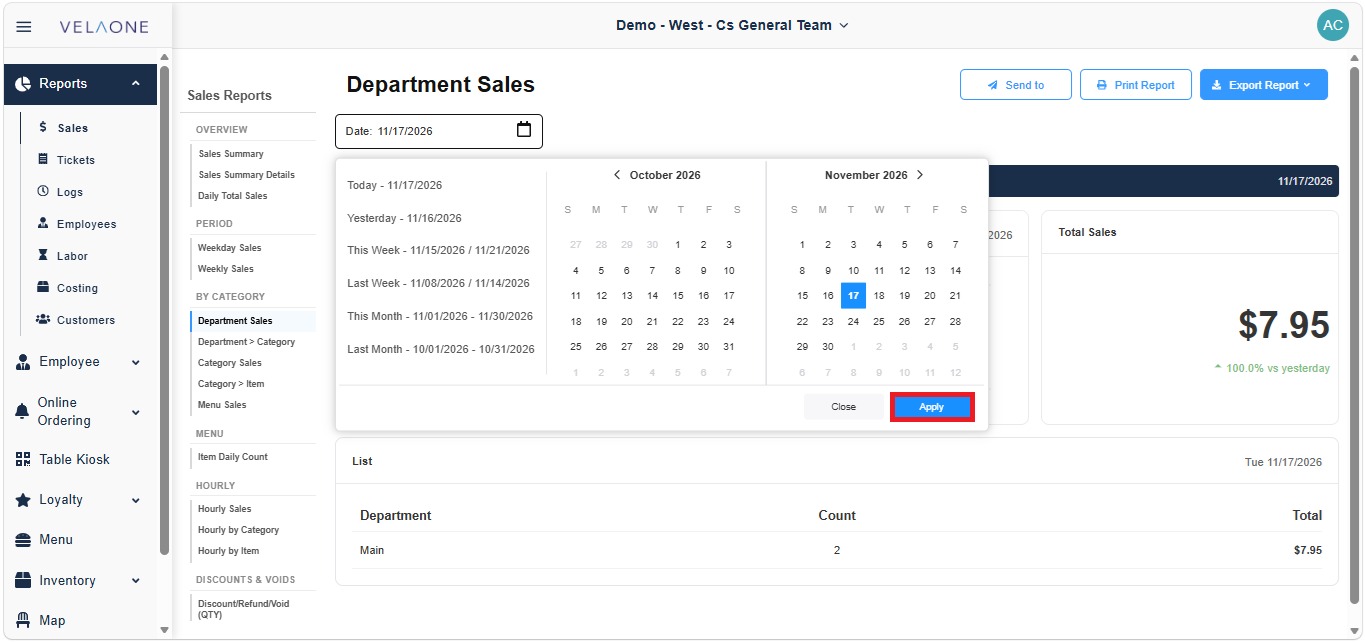
Click APPLY to load the report for the selected date.
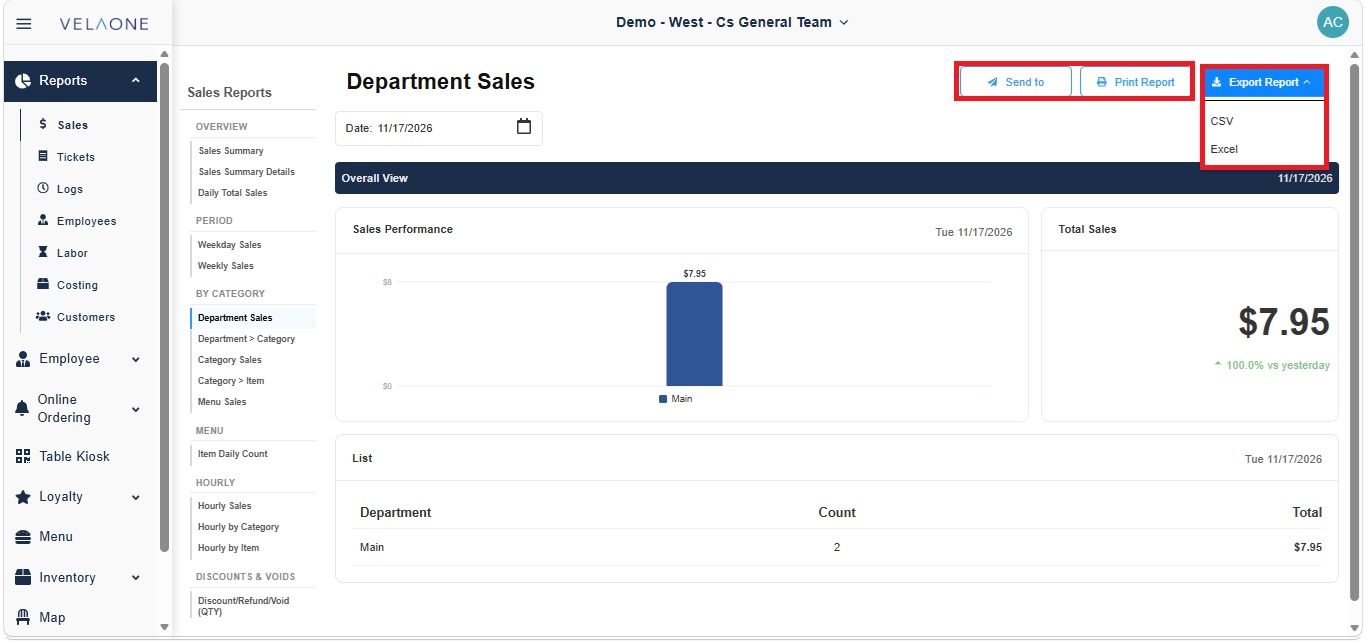
Export Options
SEND TO: sends the report to a recipient.
PRINT REPORT: prints the report as it is displayed.
EXPORT REPORT: downloads the report. Click EXPORT REPORT, then select CSV or EXCEL.
DEPARTMENT SALES: shows sales by department. The LIST table displays the DEPARTMENT, the COUNT of items sold and the TOTAL amount.
DEPARTMENT > CATEGORY: shows the sales of each category within its department. The LIST table displays the DEPARTMENT, CATEGORY, COUNT and TOTAL columns.
CATEGORY SALES: shows sales by category, including discounts. The CATEGORIES table displays the CATEGORY, COUNT, DISCOUNT and TOTAL columns. Discounts appear as negative amounts.
CATEGORY > ITEM: shows the items sold in each category. In the LIST section, each category appears as a row with its total. Click a category row to expand it and see its items with the PRODUCT, COUNT and SUBTOTAL columns. Click the row again to collapse it.
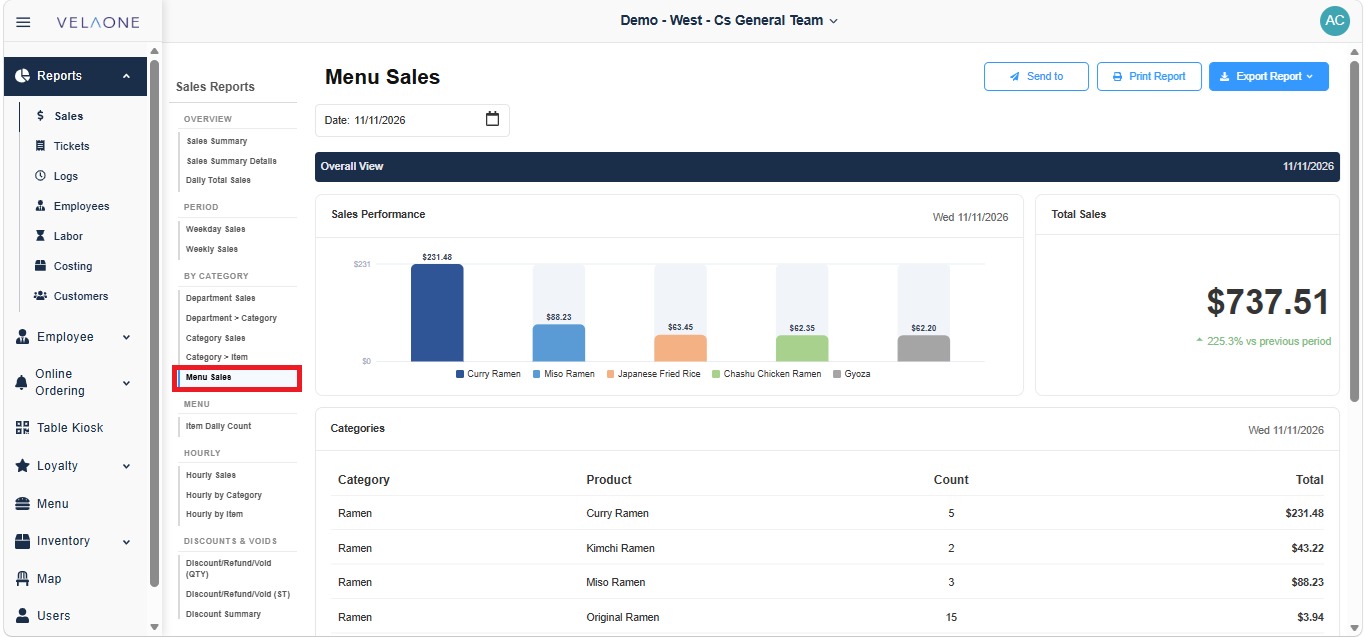
MENU SALES: shows sales by menu item. The SALES PERFORMANCE chart displays the items with the highest sales. The CATEGORIES table lists each item with its CATEGORY, PRODUCT, COUNT and TOTAL.