Customer Retention
The Customer Retention report shows how many of your customers in the selected date range are new and how many are returning, how often they visit, and which customers have stopped visiting. Use it to measure customer loyalty and find customers to reach out to.
Main Screen> MENU> REPORTS> SALES> REPORT LIST> CUSTOMER RETENTION
From the Main Screen, go to MENU and press REPORTS.

Under the SALES tab, select REPORT LIST. In the TYPE field, select CUSTOMER RETENTION.

FILTERS
Use the filters on the left side of the screen to set what the report includes.

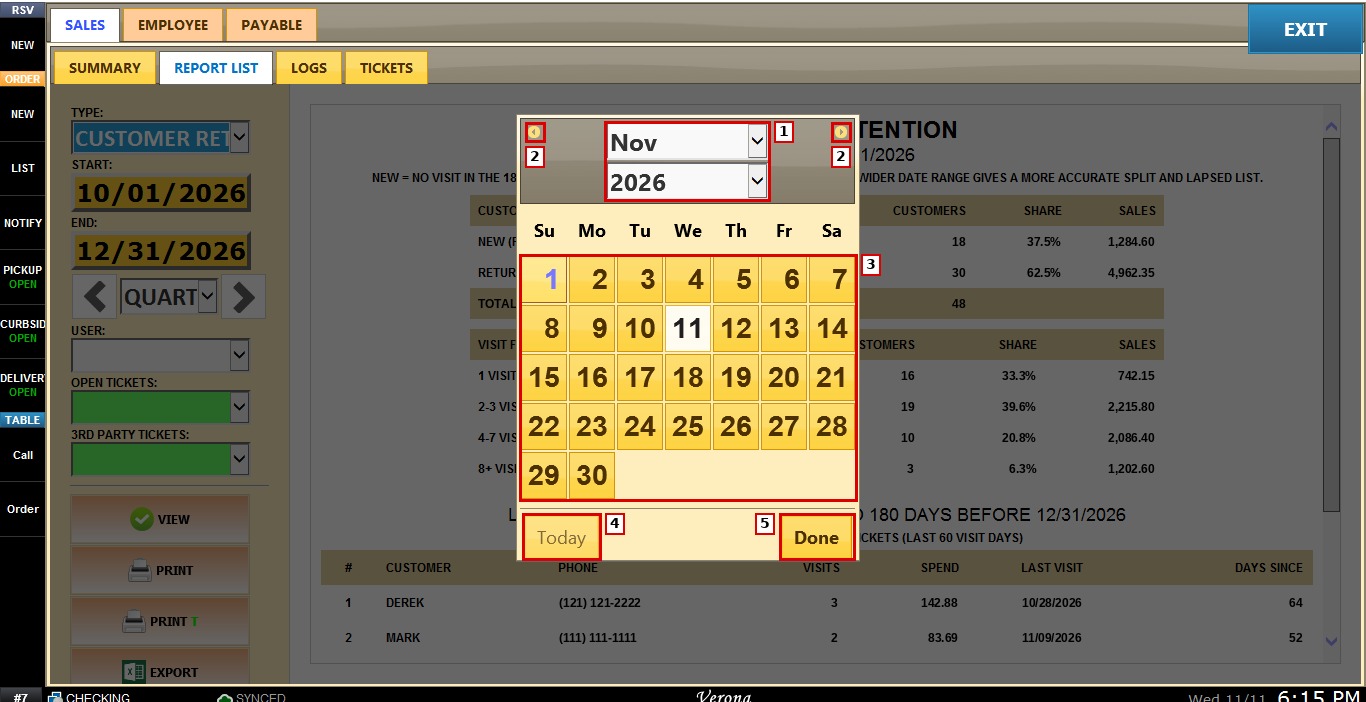
1. START: press the field to select the first date of the report. A calendar will open.
In the calendar, select the month and year from the dropdown menus, or use the arrows in the top corners to move to the previous or next month. Press the day you want, or press TODAY to select the current date. Then press DONE to confirm.
2. END: press the field to select the last date of the report, following the same steps in the calendar.
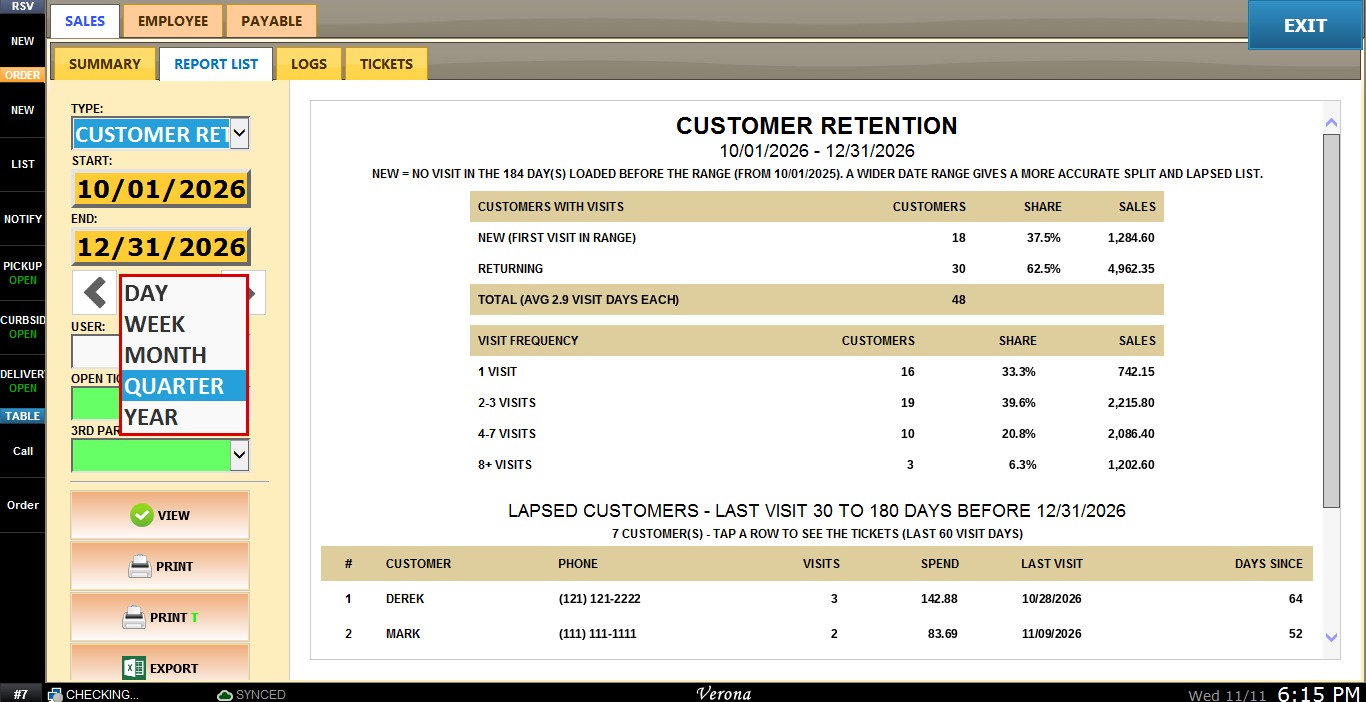
3. PERIOD SELECTOR: filters the report by DAY, WEEK, MONTH, QUARTER or YEAR. Use the side arrows to move backward or forward through those periods.
4. USER: filters the report by a single user. Leave it blank to include all users.
5. OPEN TICKETS: sets whether open tickets are included in the report.
6. 3RD PARTY TICKETS: sets whether tickets from third-party sources are included in the report.
REPORT OPTIONS
1. VIEW: displays the report using the selected filters.
2. PRINT and PRINT T: print the report.
3. EXPORT: exports the report data to an Excel file for analysis or recordkeeping.
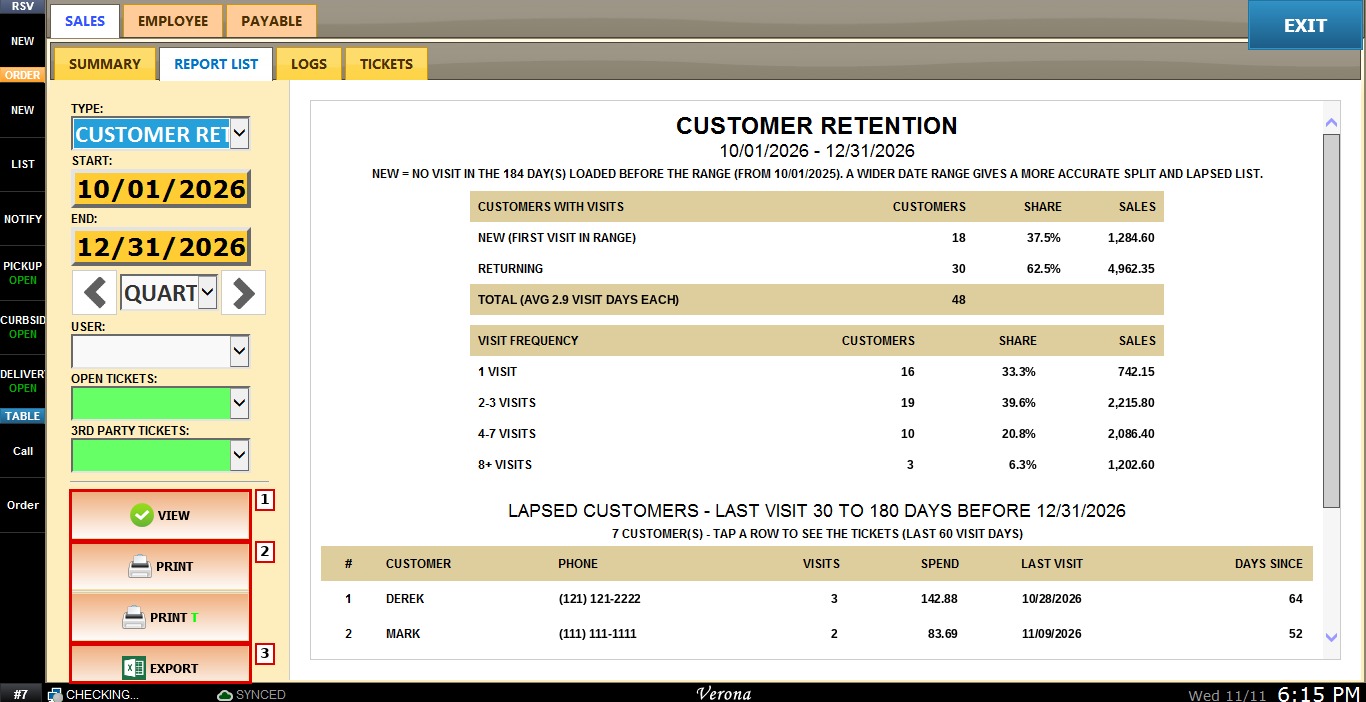
After setting the filters, press VIEW to display the report.
Result:
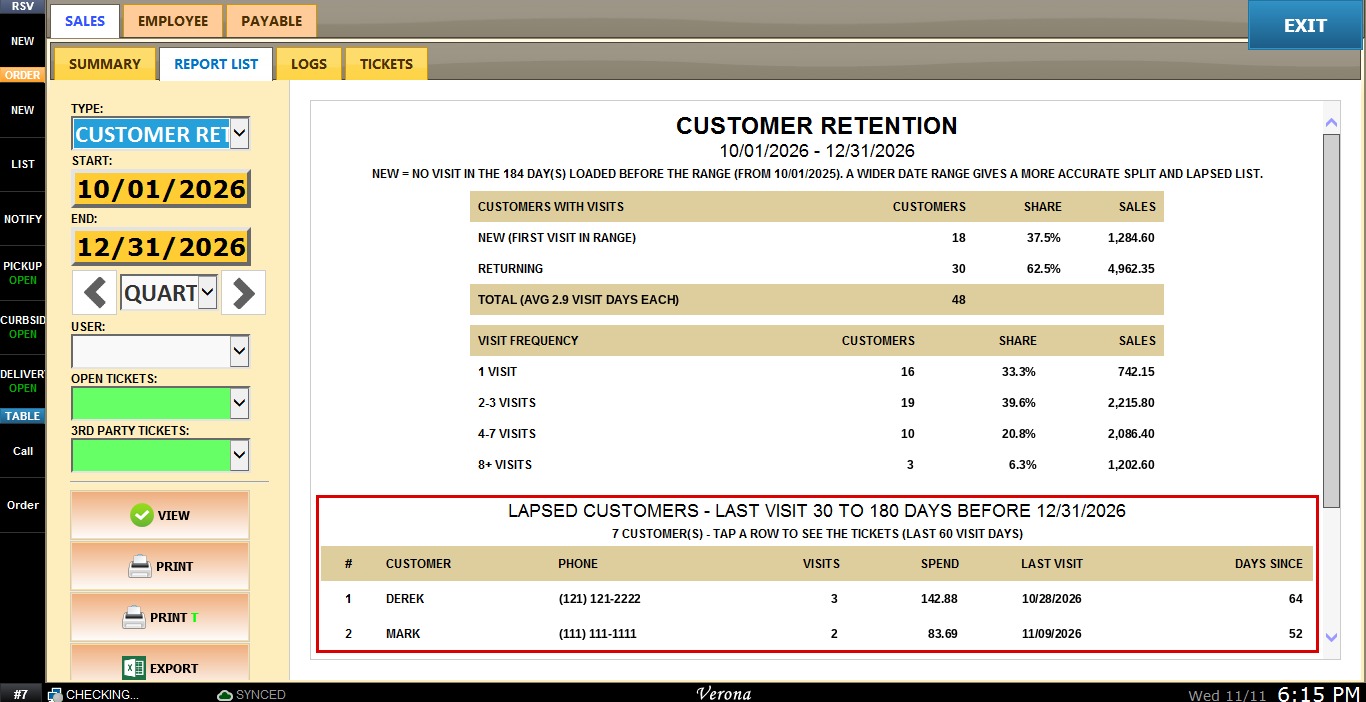
The Customer Retention report appears with the selected date range under the title. The note below it explains how new customers are identified: a customer is NEW if they had no visit in the days loaded before the range. A wider date range gives a more accurate result.
CUSTOMERS WITH VISITS: splits the customers who visited in the selected range into two groups.
- NEW (FIRST VISIT IN RANGE): customers whose first visit was in the selected range.
- RETURNING: customers who had already visited before the selected range.
- TOTAL: the total number of customers, and the average number of days each customer visited.
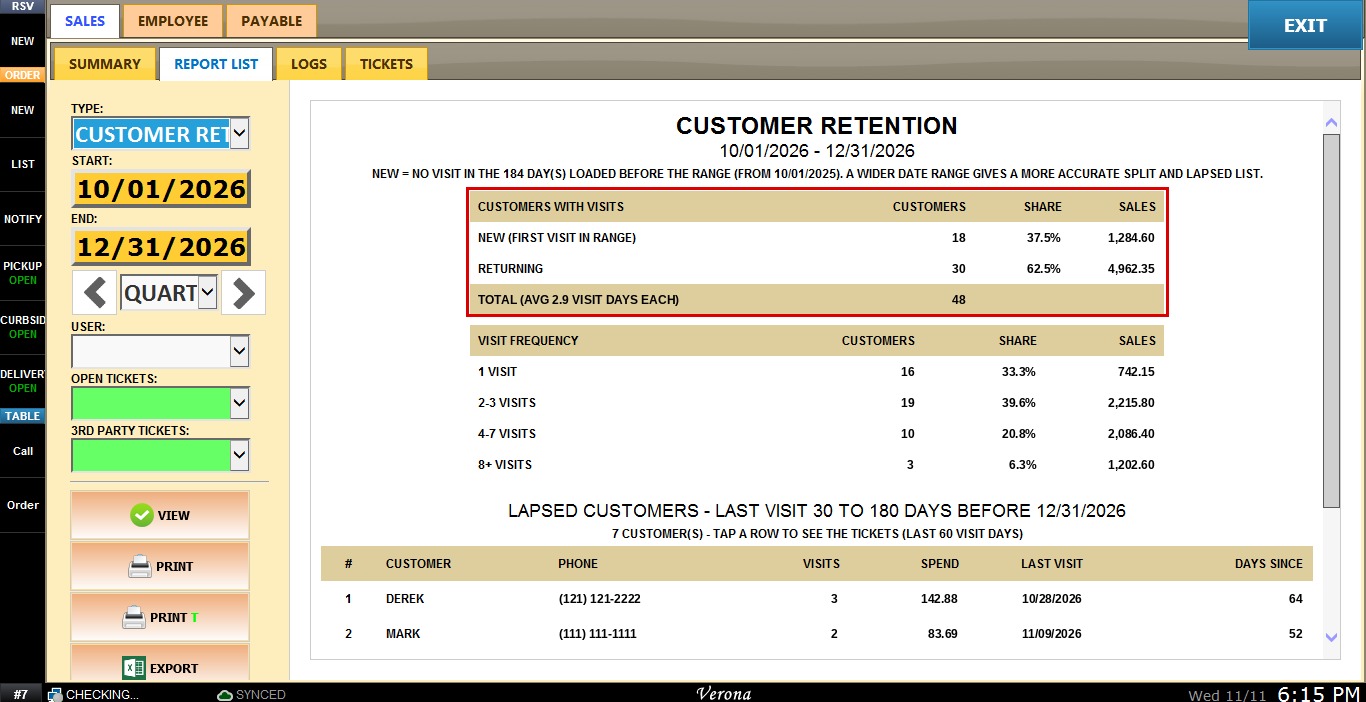
VISIT FREQUENCY: groups the customers by how many times they visited in the selected range: 1 VISIT, 2-3 VISITS, 4-7 VISITS and 8+ VISITS.

Both tables show the number of CUSTOMERS in each group, their SHARE of all customers, and the SALES they generated.
LAPSED CUSTOMERS: lists the customers whose last visit was 30 to 180 days before the end date of the report. The columns are:
- #: the customer’s position in the list.
- CUSTOMER: the customer’s name.
- PHONE: the customer’s phone number.
- VISITS: the number of visits the customer made.
- SPEND: the total amount the customer spent.
- LAST VISIT: the date of the customer’s most recent visit.
- DAYS SINCE: the number of days since the customer’s last visit.