Department Category
The Department-Category report shows how much each category sold inside each department in a selected date range. Use it to see which categories of your menu bring in the most sales.
Main Screen> MENU> REPORTS> SALES> REPORT LIST> DEPARTMENT-CATEGORY
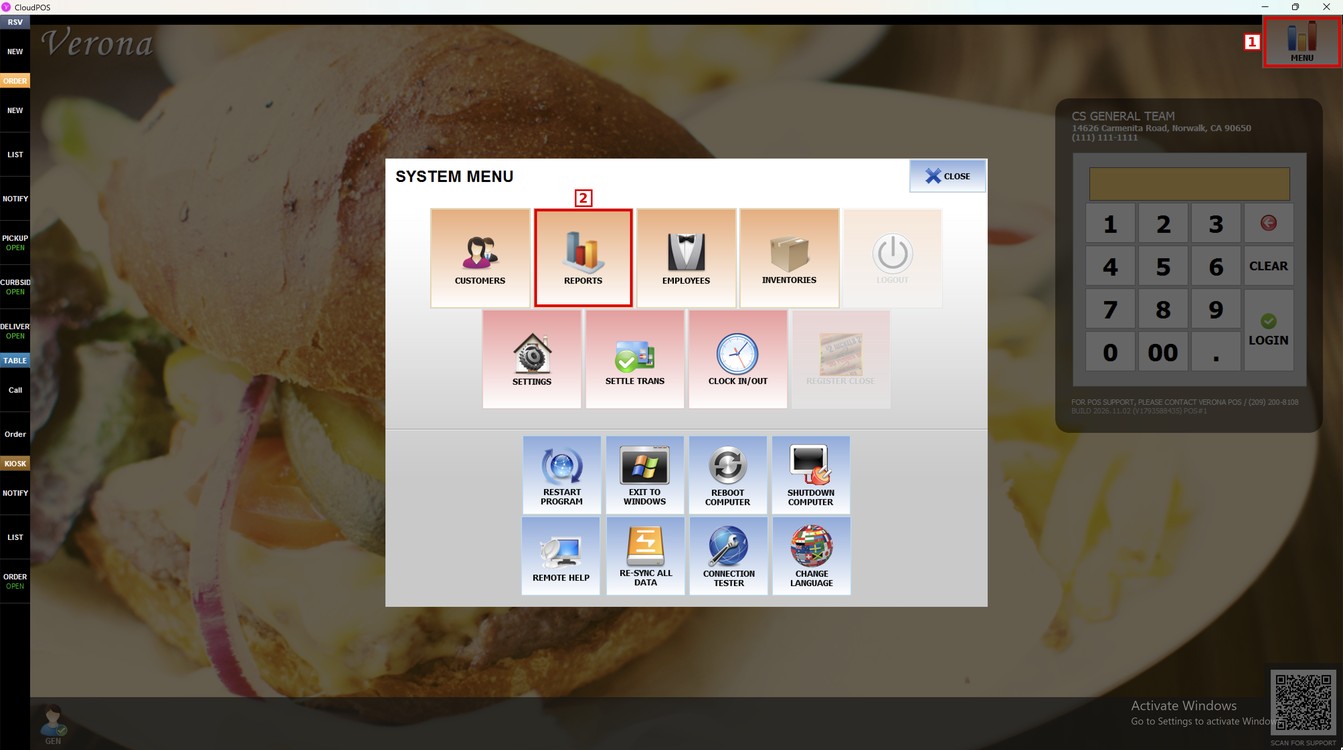
Press MENU and then REPORTS.
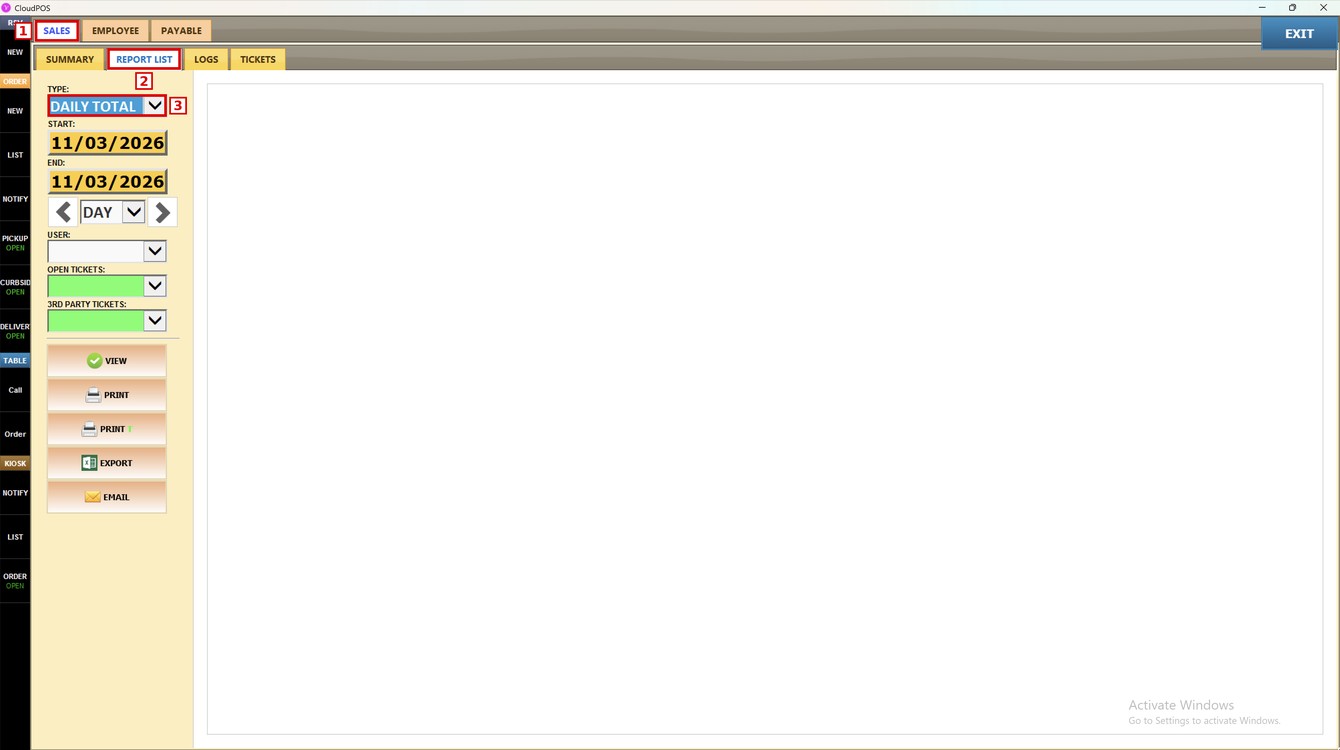
Go to the SALES tab, open REPORT LIST and press the TYPE dropdown.
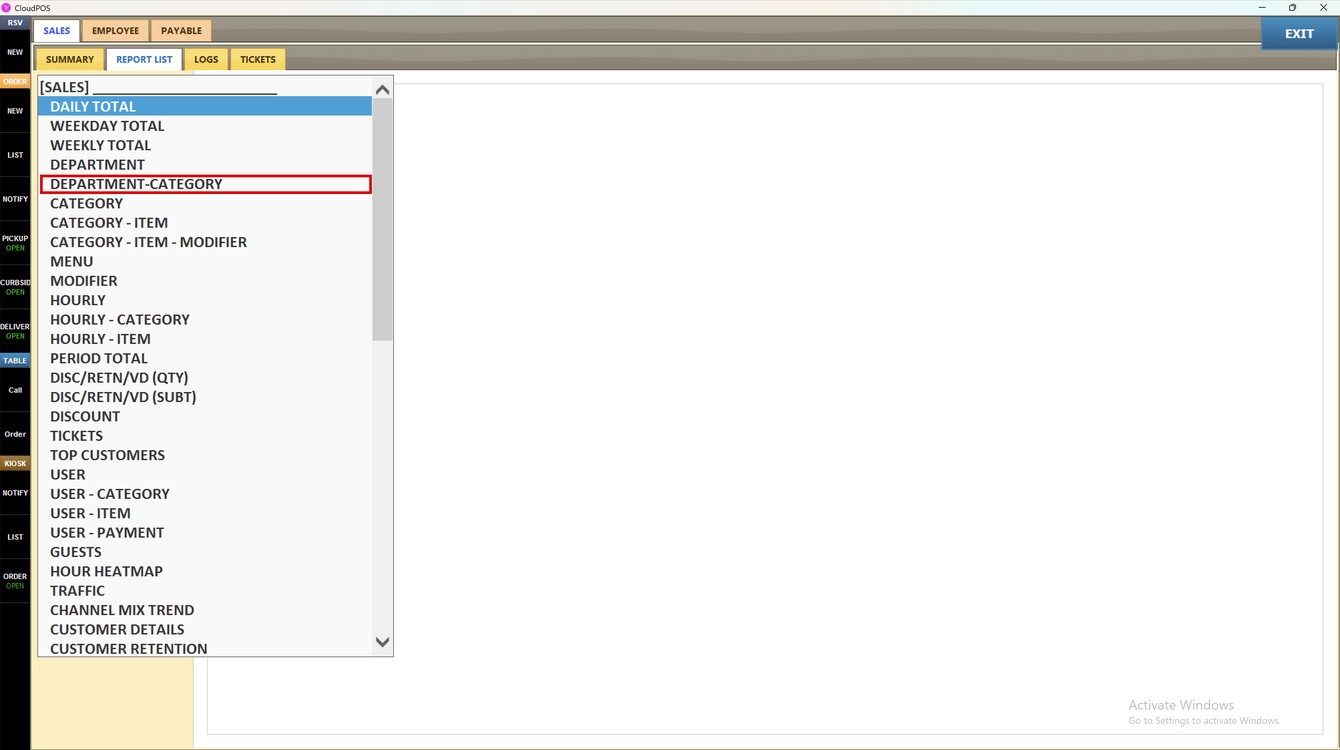
Select DEPARTMENT-CATEGORY.
Filters and Buttons:
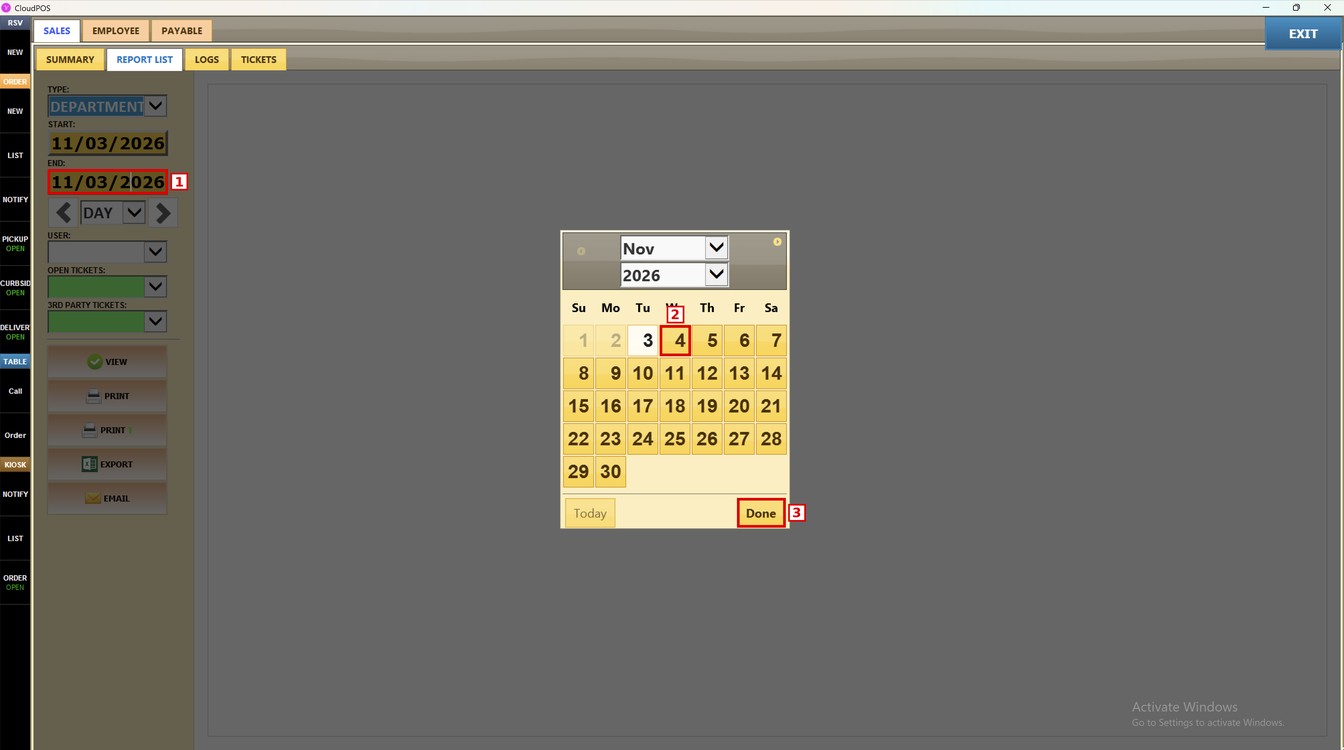
1. START: press the date field, select the first day of the range and press DONE.
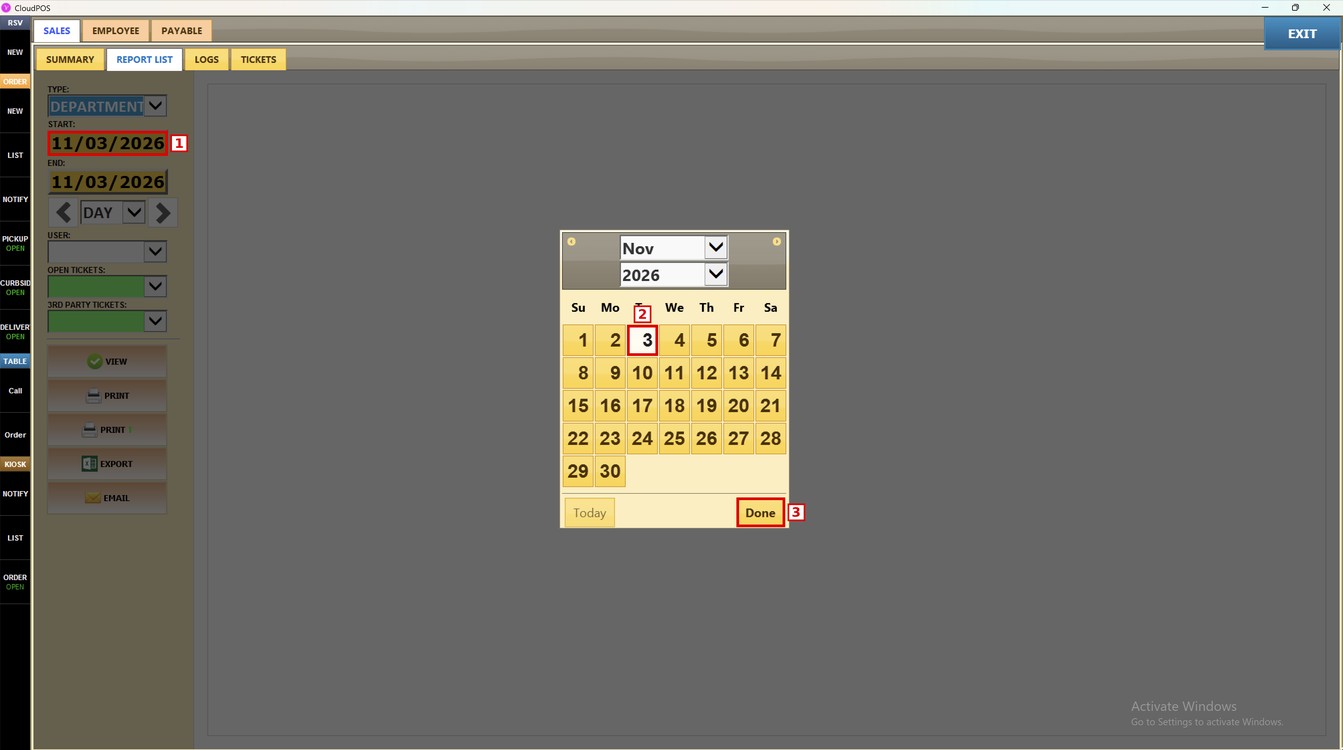
2. END: press the date field, select the last day of the range and press DONE. Days before the start date cannot be selected.
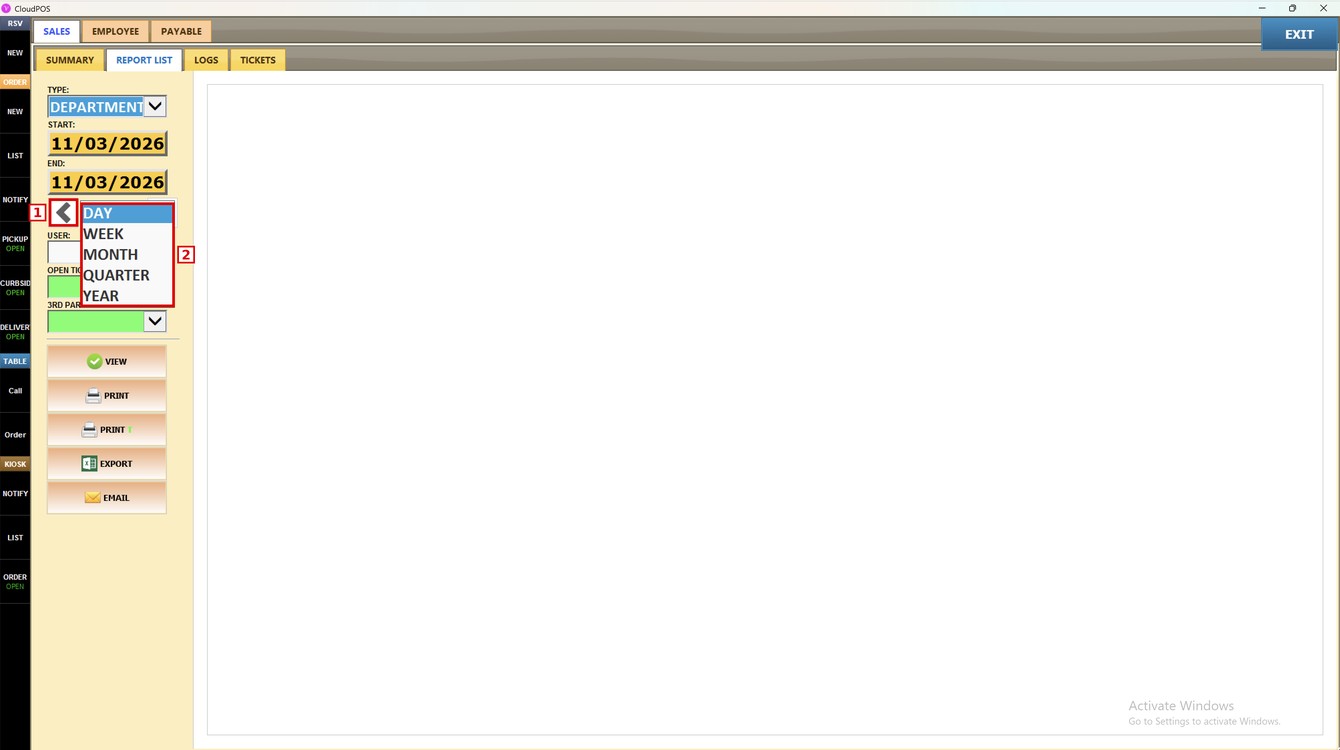
3. PERIOD: choose DAY, WEEK, MONTH, QUARTER or YEAR to fill the dates automatically. Use the arrows to move to the previous or next period.
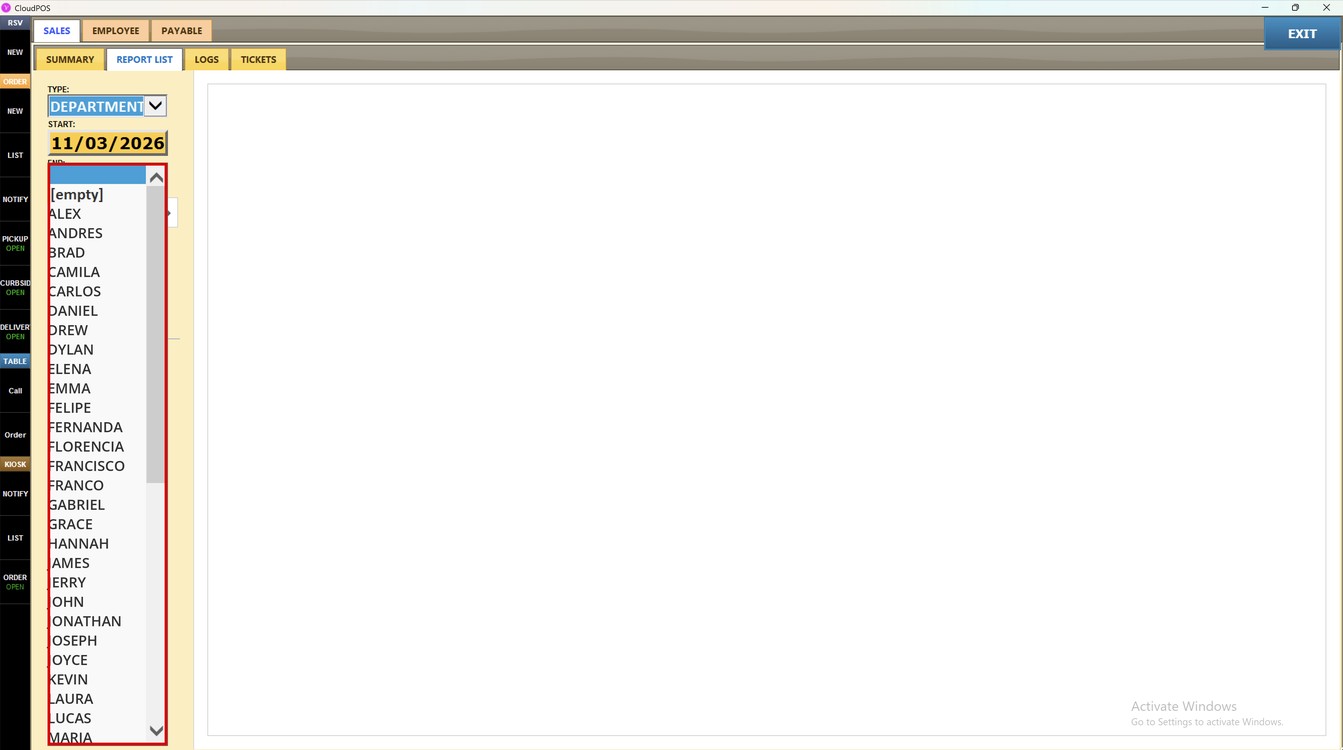
4. USER: select an employee to see only their sales. Leave it empty to see all employees.
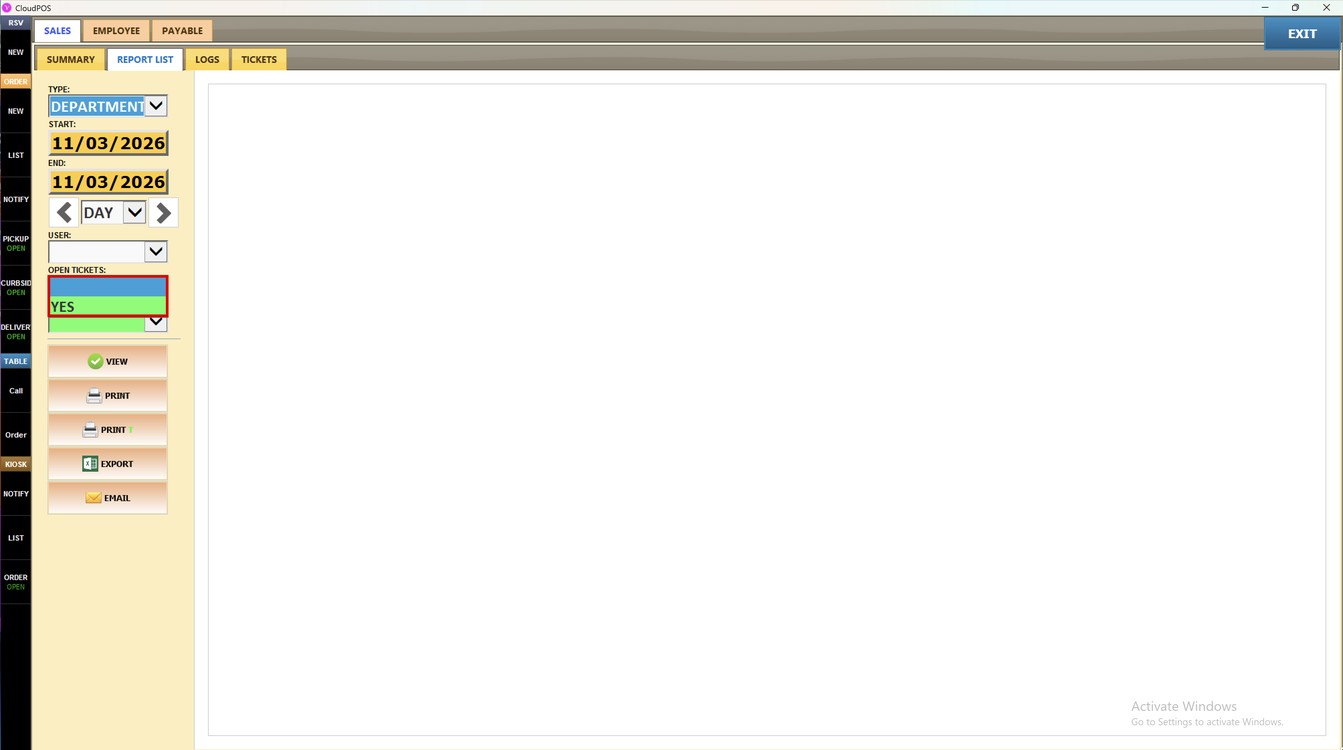
5. OPEN TICKETS: select YES to include tickets that are still open.
6. 3RD PARTY TICKETS: select YES to include tickets from third-party sources.
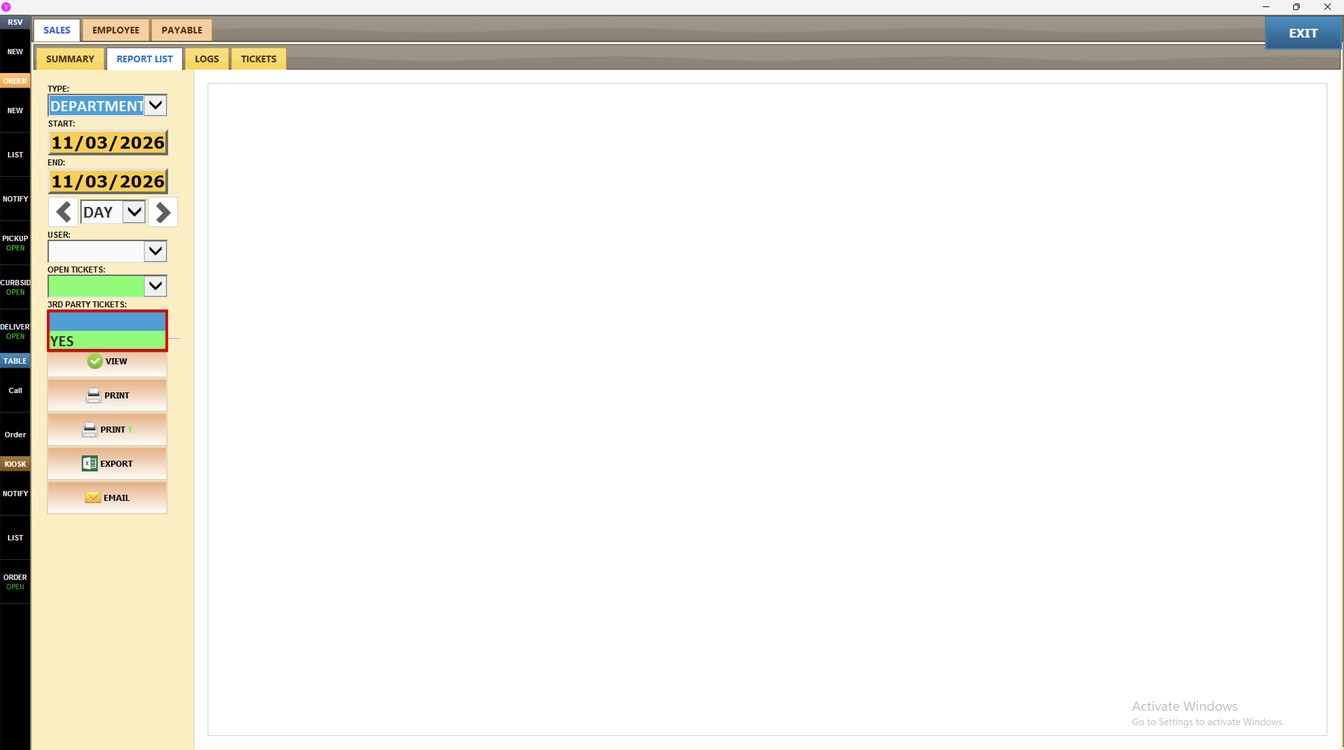
Press VIEW to show the report.
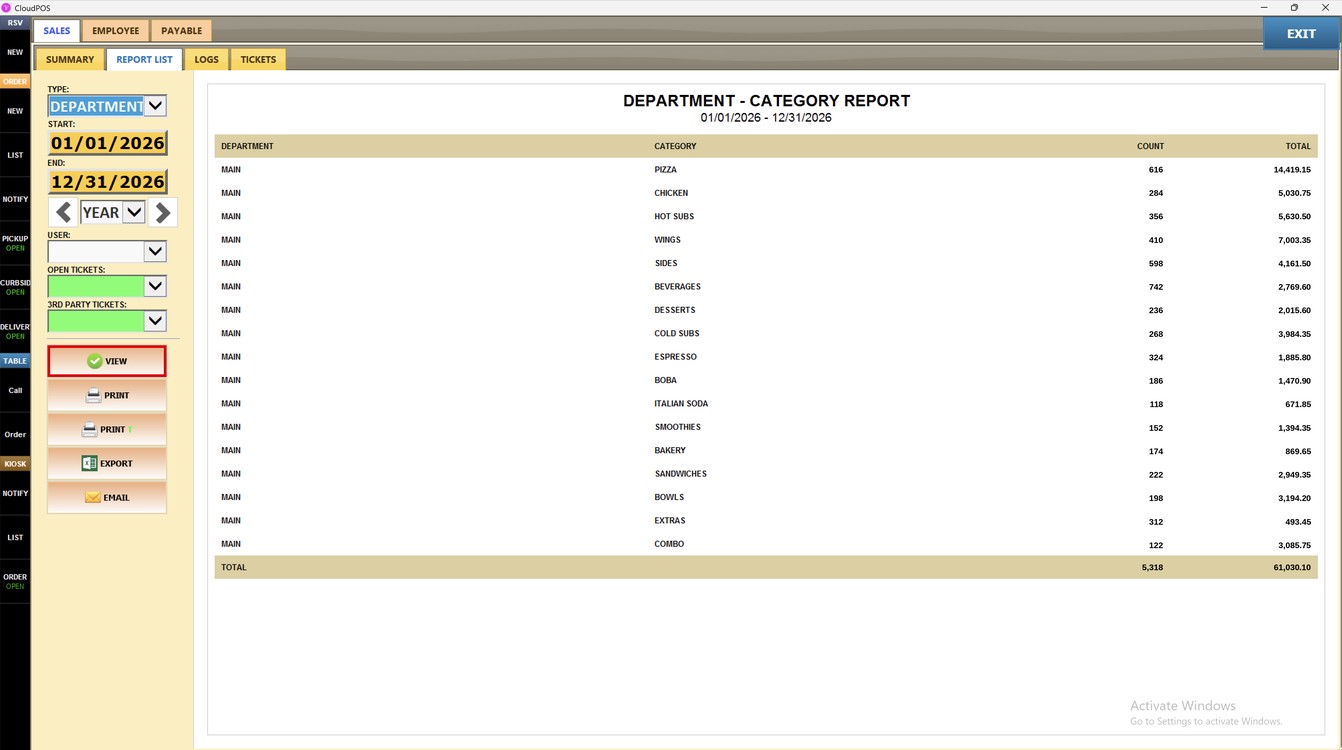
Report Content Explanation:
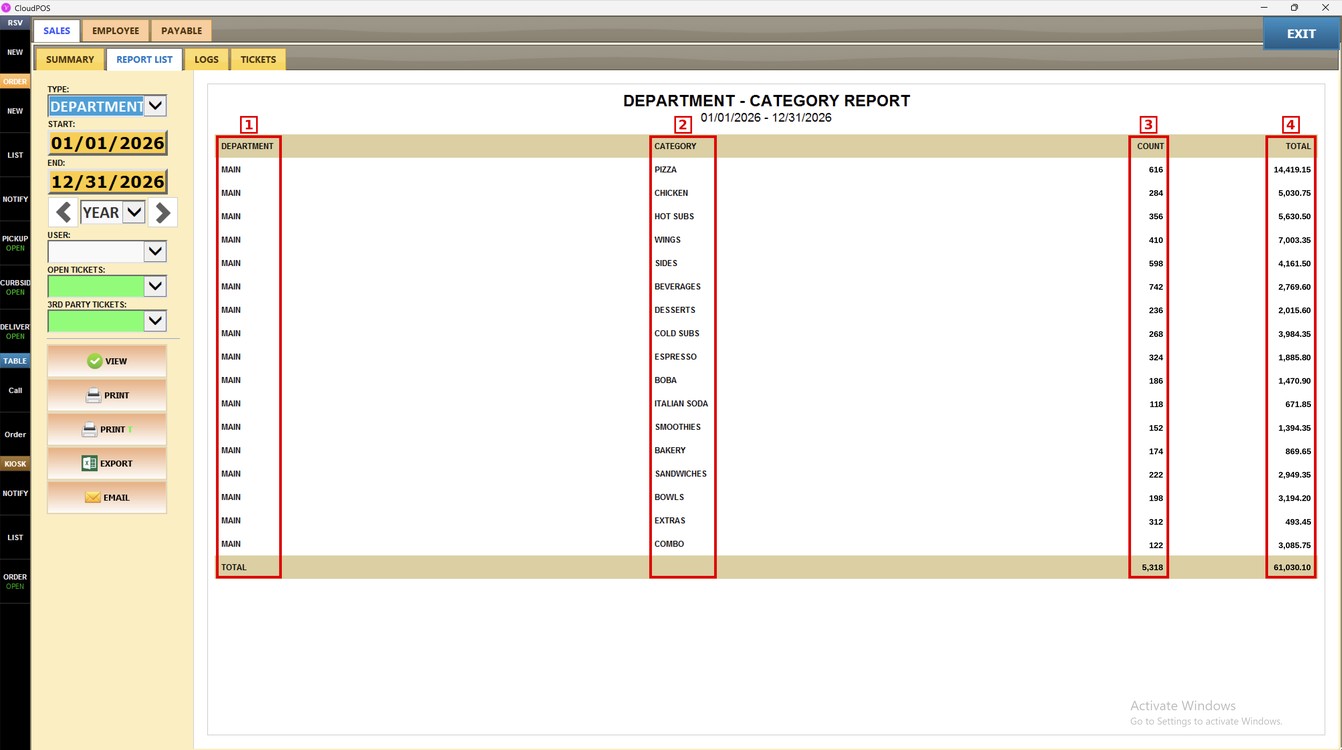
Each row is one category and the department it belongs to. The last row shows the TOTAL of all categories.
1. DEPARTMENT: name of the department.
2. CATEGORY: name of the category.
3. COUNT: number of items sold in the category.
4. TOTAL: sales amount of the category.
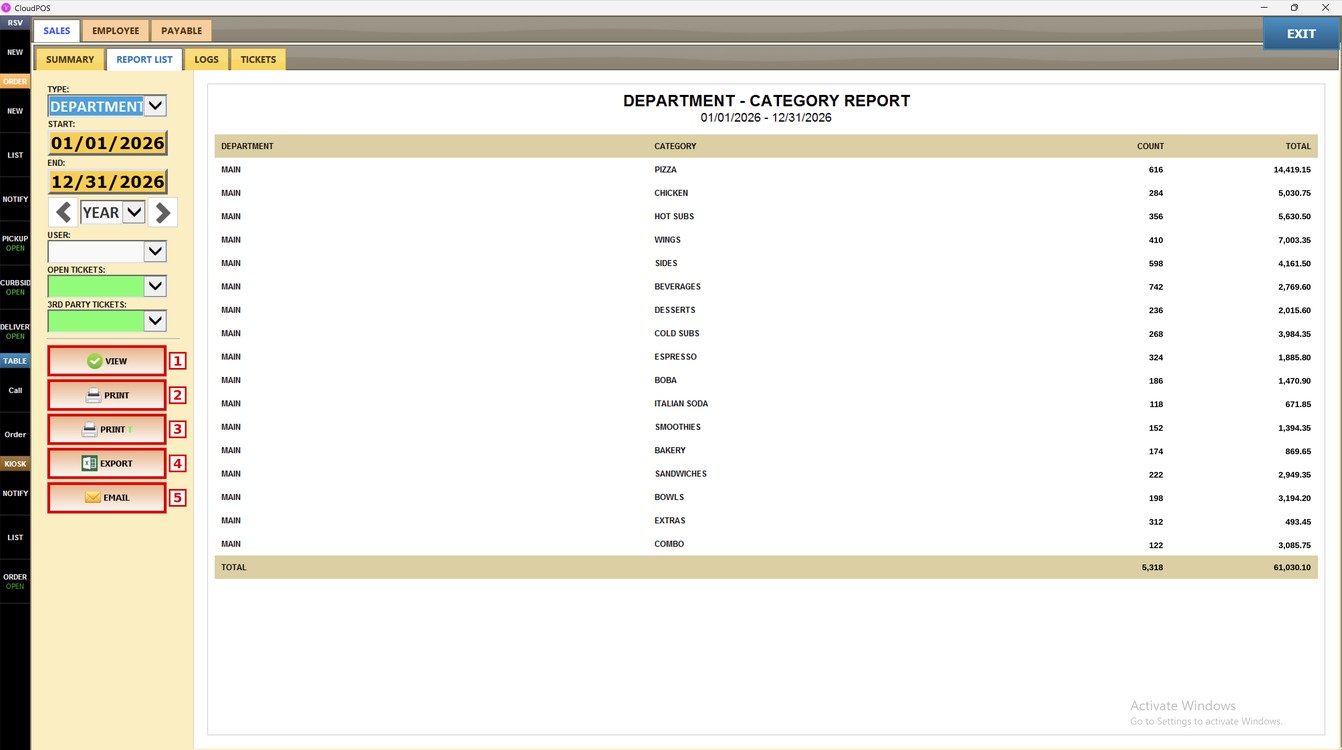
Additional Options:
1. VIEW: shows the report on screen.
2. PRINT: generates a printable version of the report.
3. PRINT T: prints the report on the receipt printer.
4. EXPORT: exports the report to an Excel file.
5. EMAIL: sends the report by email.
To learn how to see the sales of each department only, please refer to the Department Guide.