Hour HeatMap
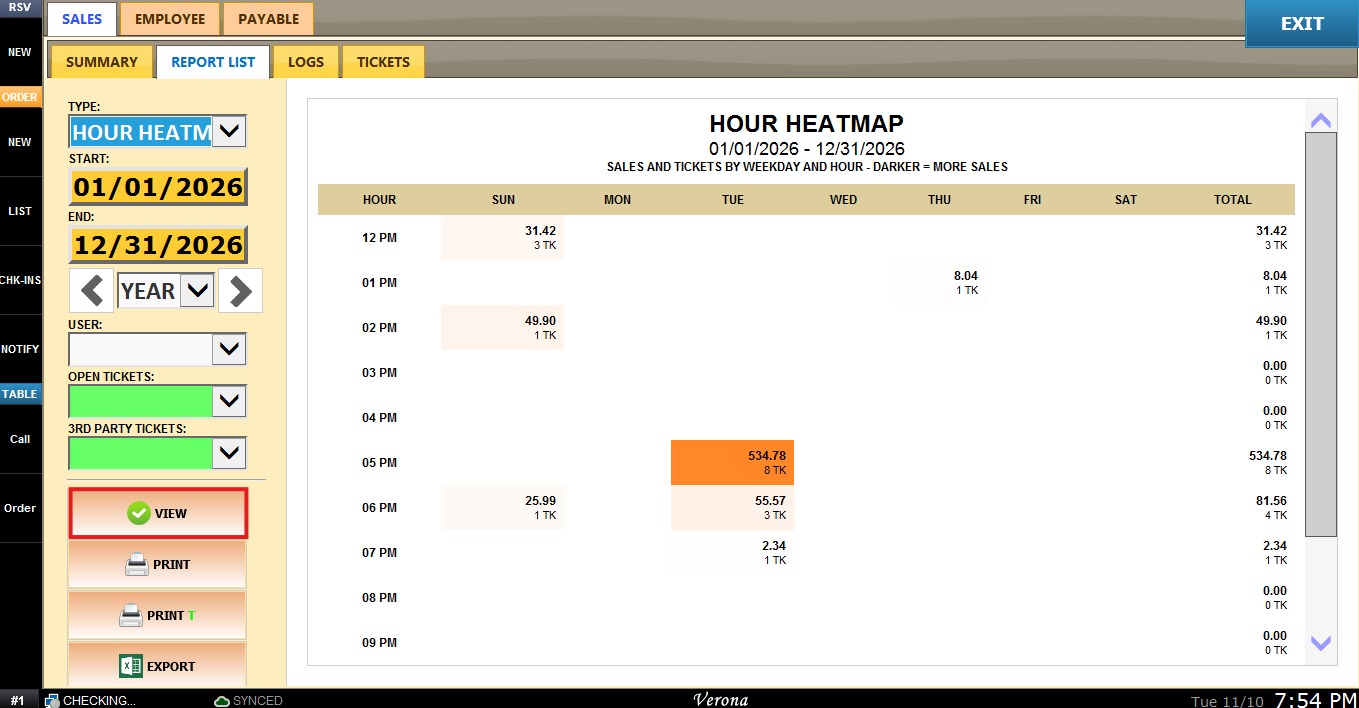
This report shows which hours and weekdays bring in the most sales.
Main Screen> MENU> REPORTS> SALES> REPORT LIST> HOUR HEATMAP> VIEW
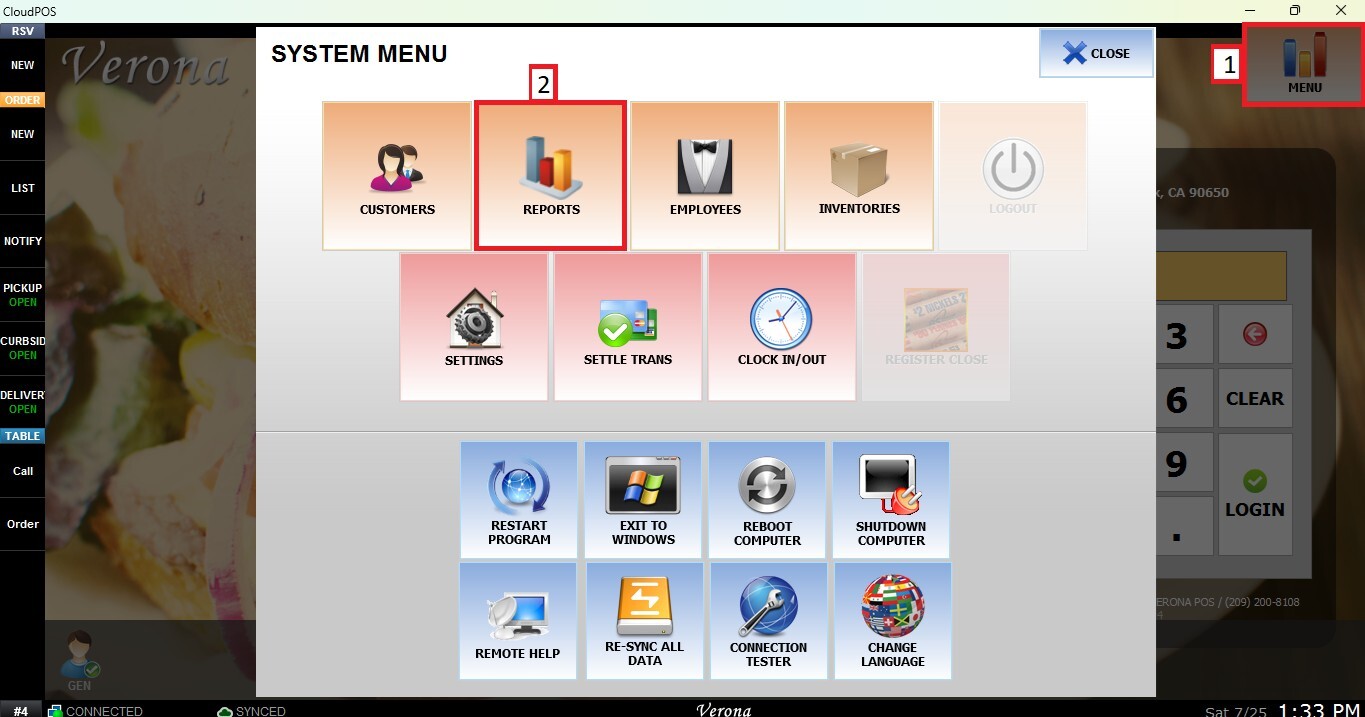
From the MAIN SCREEN, click MENU, then select REPORTS.
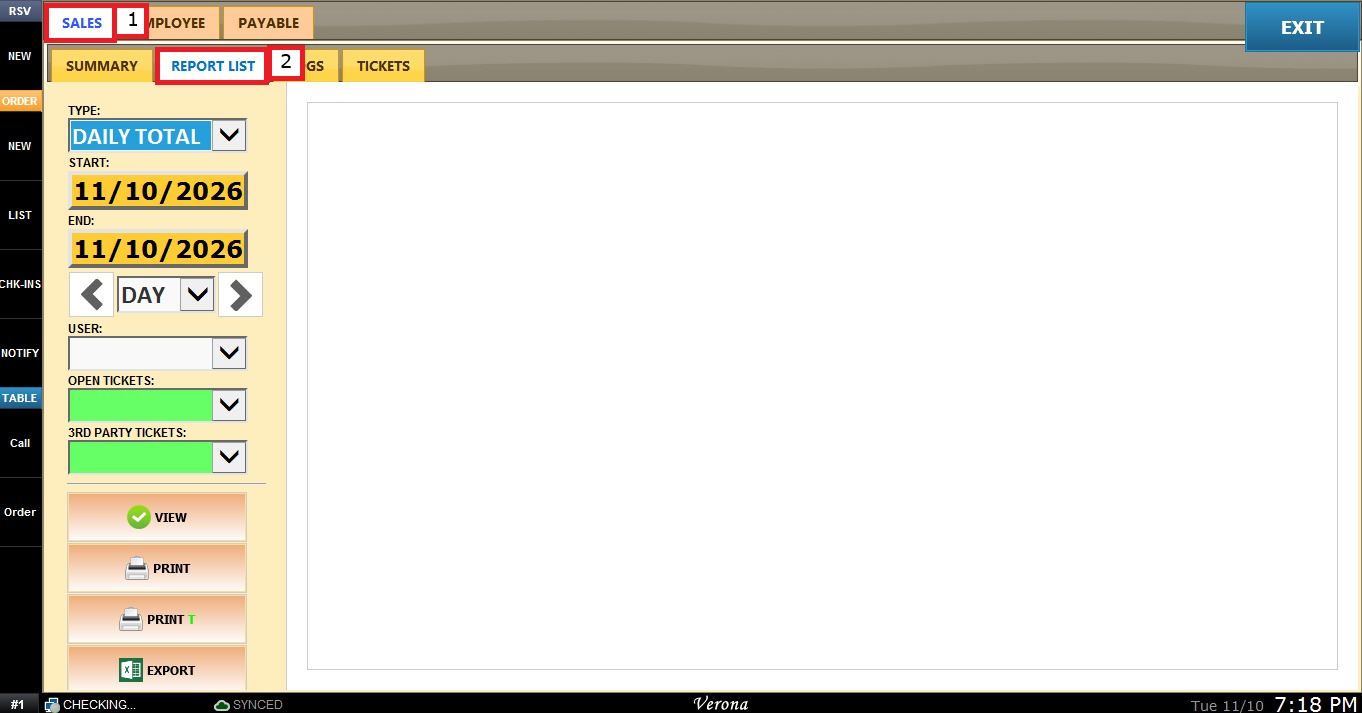
Open the SALES tab and click REPORT LIST.
Open the TYPE dropdown and select HOUR HEATMAP.
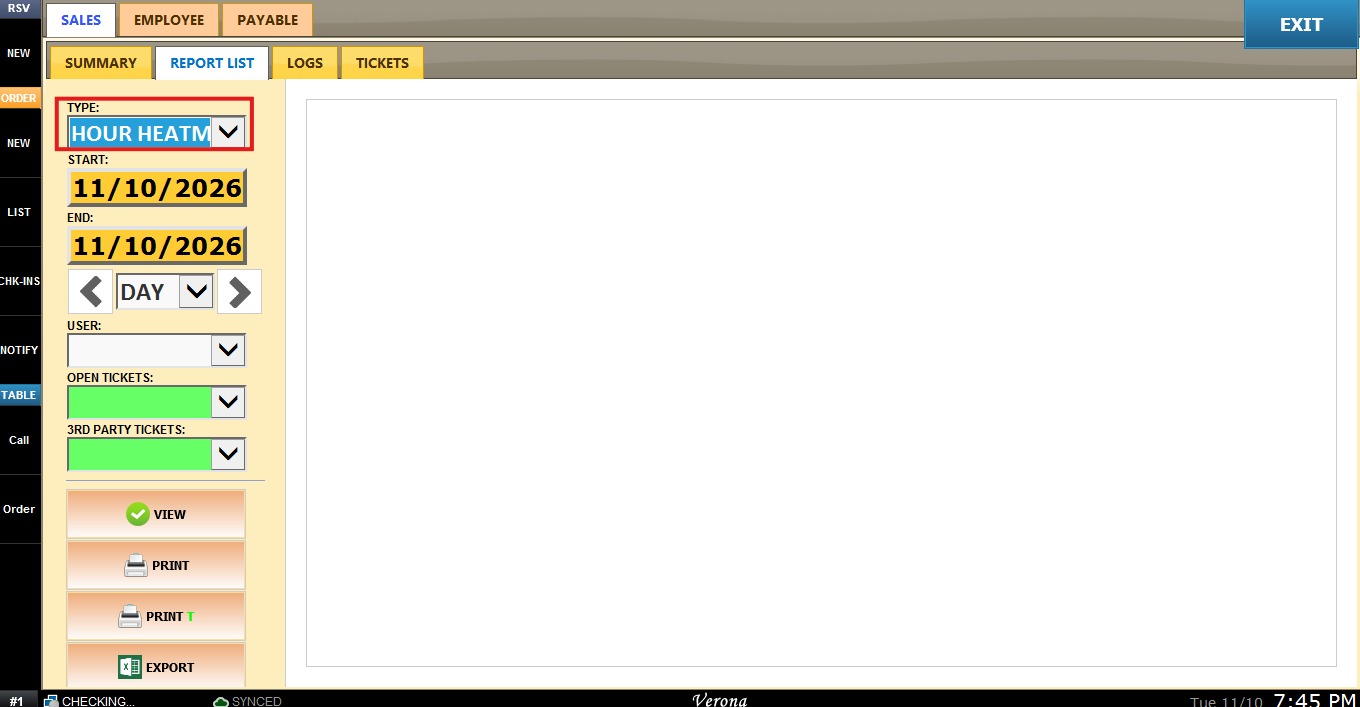
The report area stays blank until the filters are applied with VIEW.
FILTERS
The filters are in the panel on the left side of the screen, below the TYPE dropdown.
1. START: sets the first day of the report period.
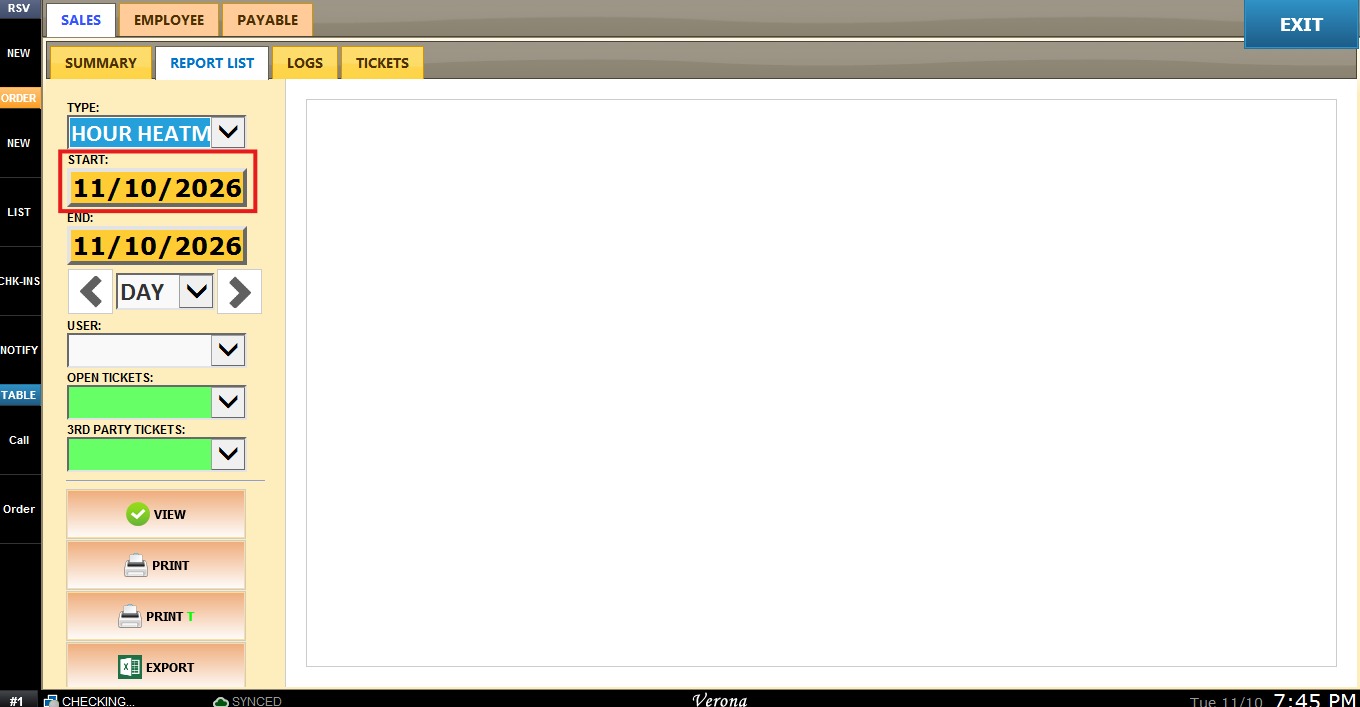
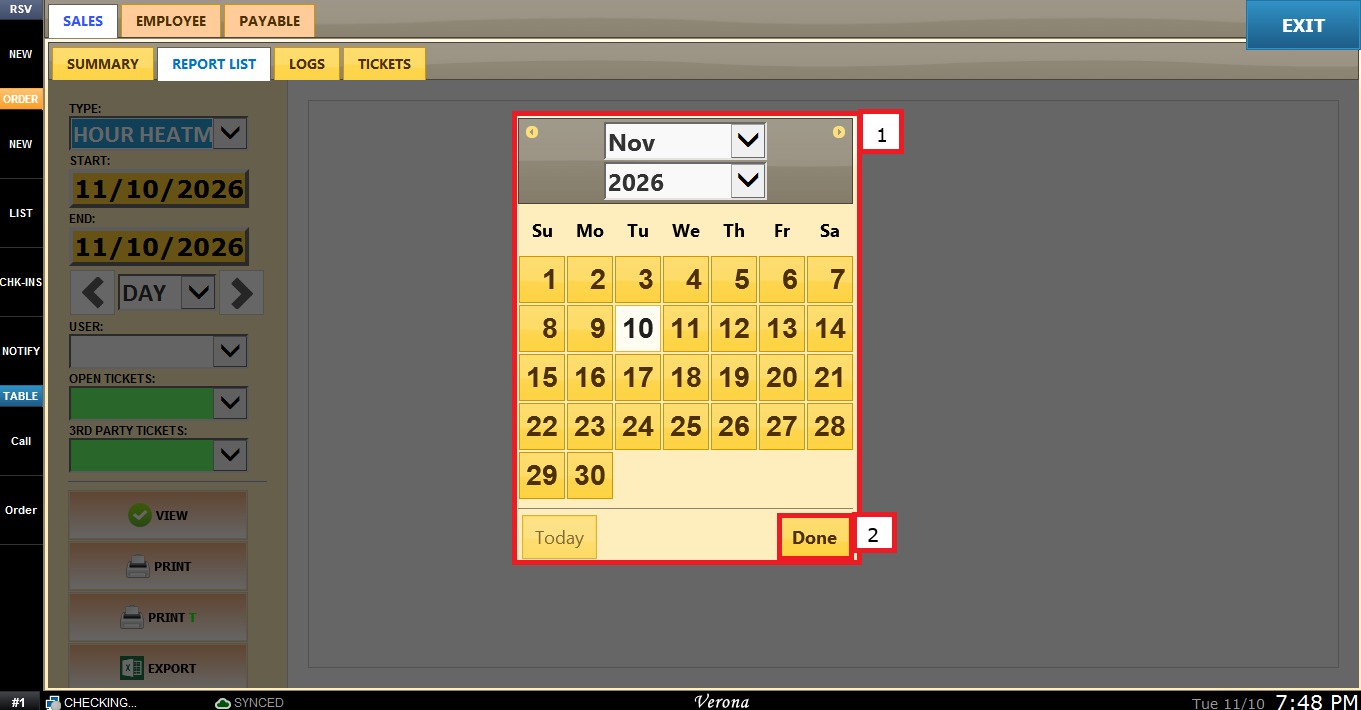
Click the START date button.
In the calendar, select the month and year from the dropdowns at the top, or use the arrows to move between months, then click the day.
Click DONE to confirm the date.
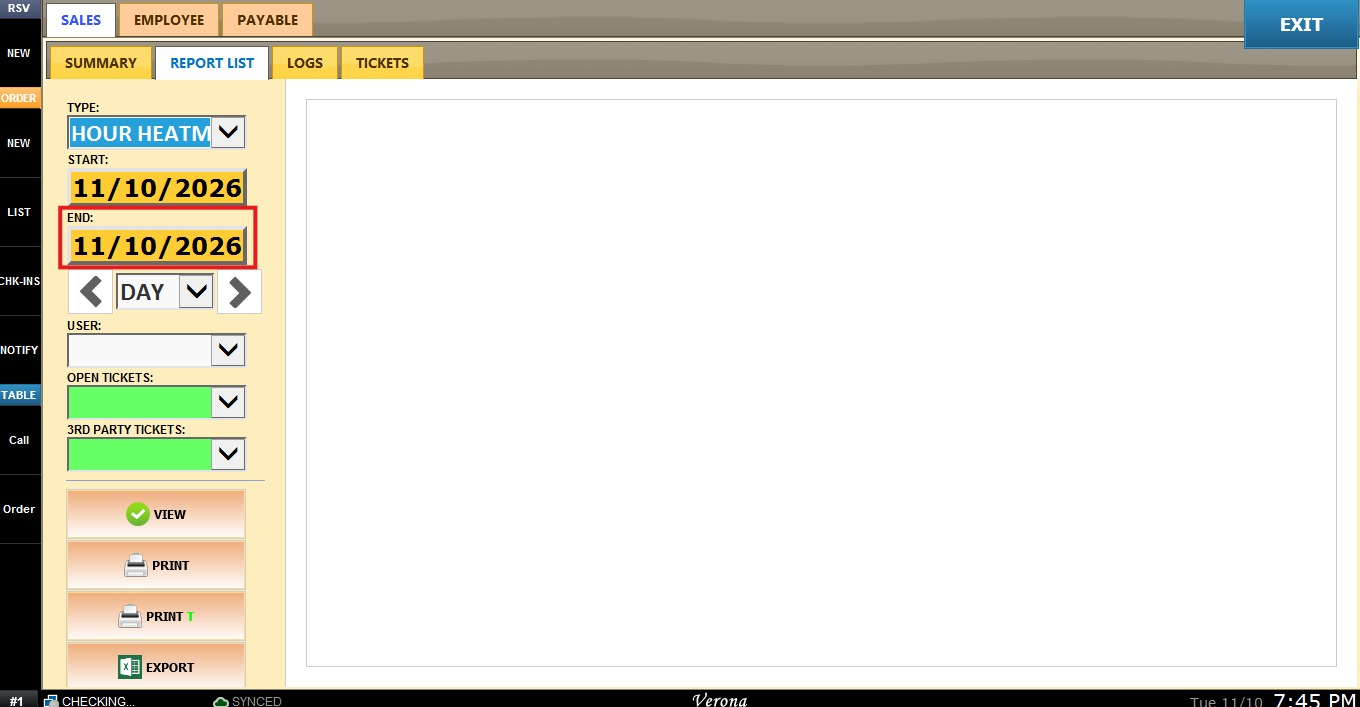
2. END: sets the last day of the report period.
Click the END date button, select the date in the calendar and click DONE.
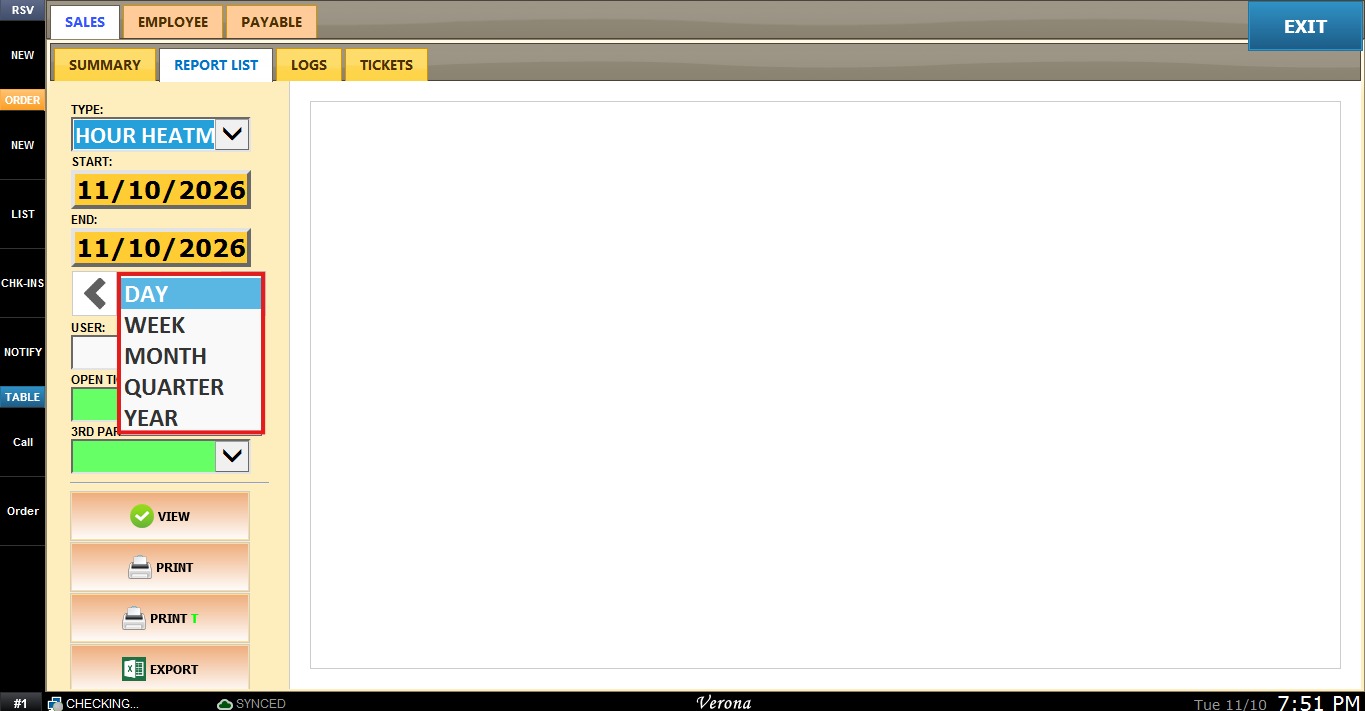
3. Period Dropdown: sets the START and END dates to a full period. The options are DAY, WEEK, MONTH, QUARTER and YEAR. For example, YEAR sets the dates from January 1 to December 31 of the year; the other options work the same way for their own period.
Open the dropdown next to the arrow buttons and select the period.
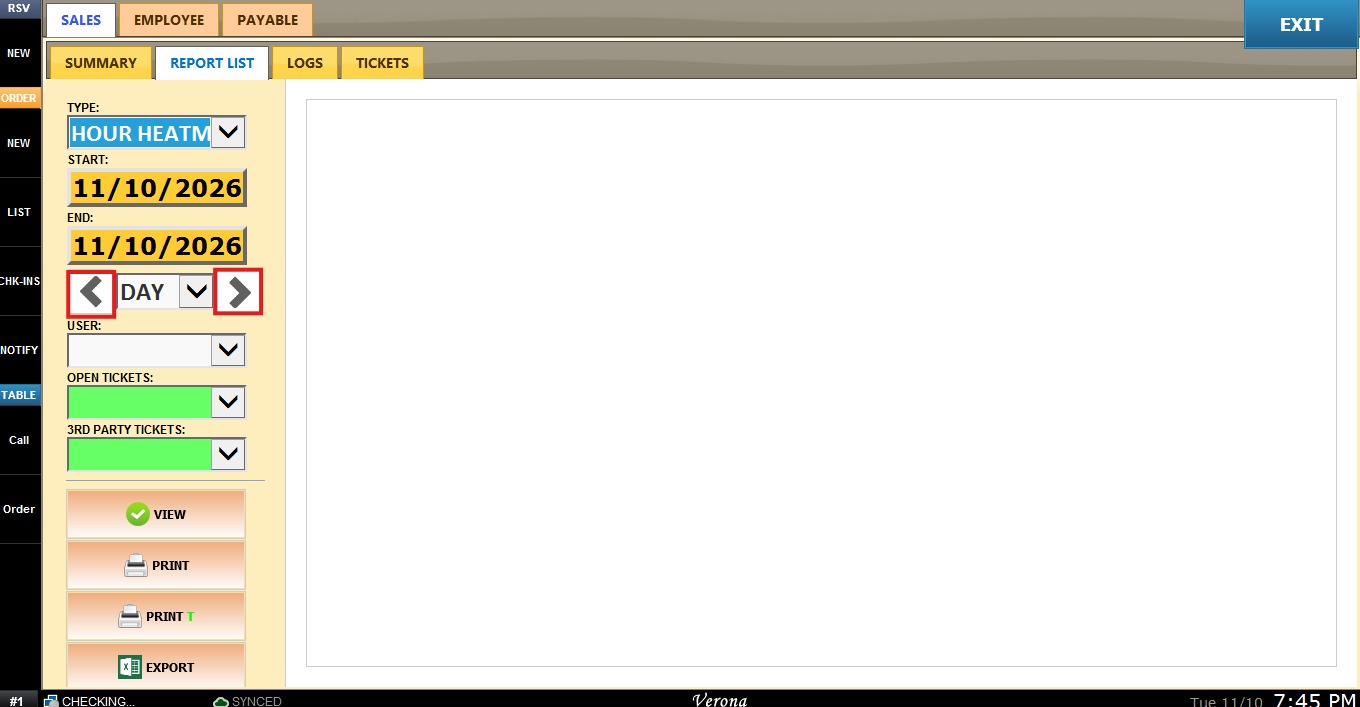
4. Arrow Buttons: move the report dates back or forward by the selected period.
Click the left arrow to go to the previous period or the right arrow to go to the next one.
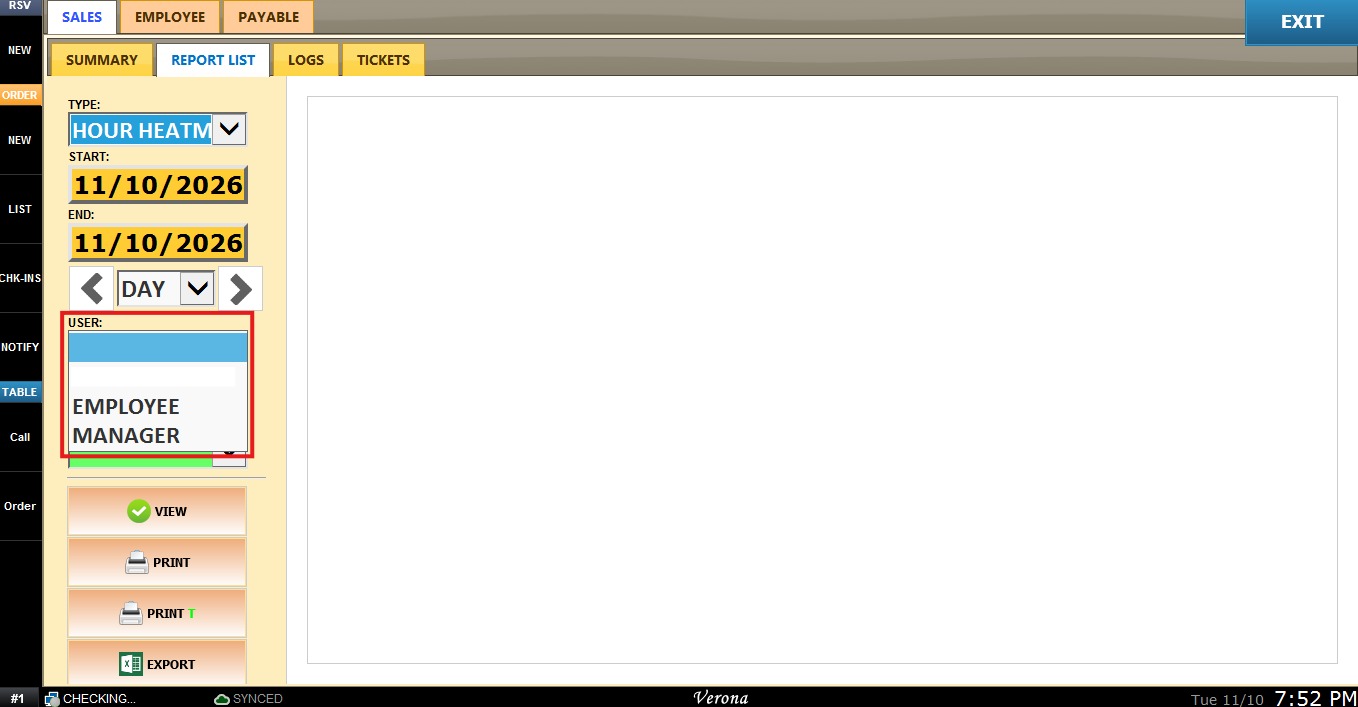
5. USER: limits the report to the sales of the selected user. Leave it blank to include all users.
Open the USER dropdown and select the user, for example EMPLOYEE or MANAGER.
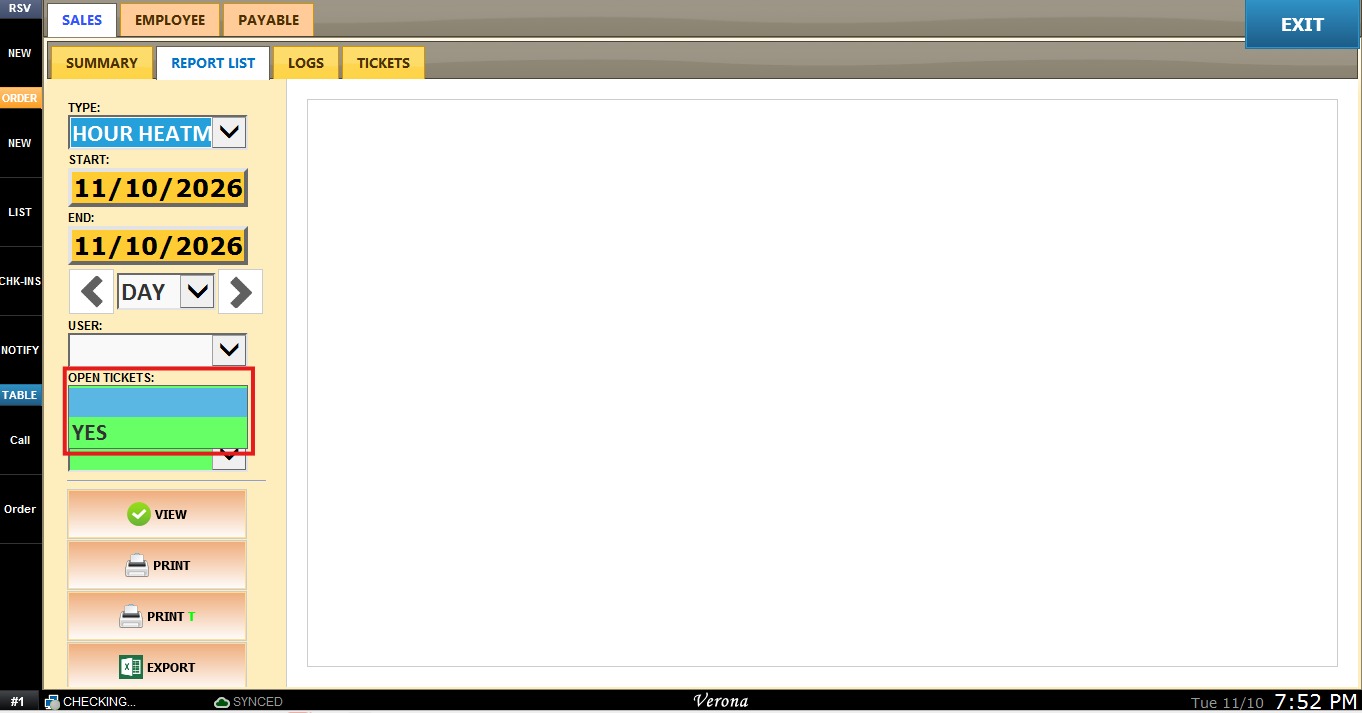
6. OPEN TICKETS: sets whether tickets that are still open are included in the report.
Open the OPEN TICKETS dropdown and select YES to include them, or leave it blank.
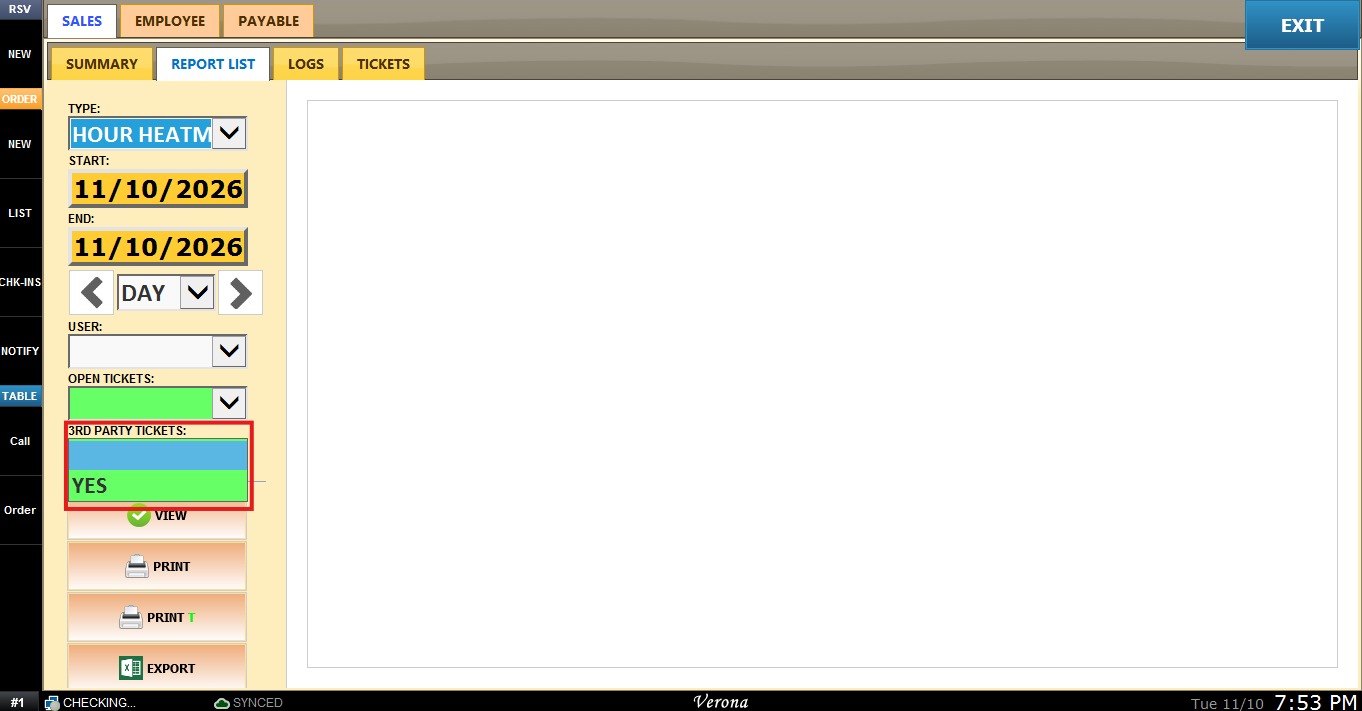
7. 3RD PARTY TICKETS: sets whether third-party tickets are included in the report.
Open the 3RD PARTY TICKETS dropdown and select YES to include them, or leave it blank.
View
Click VIEW to display the report with the applied filters. Click it again after changing a filter to refresh the report.
The report shows the selected date range and a table with one row per hour and one column per weekday, from SUN to SAT, plus a TOTAL column. Each cell shows the sales amount and the number of tickets (TK) for that hour and weekday. Darker cells mark the hours with more sales. Hours without sales show 0.00 / 0 TK in the TOTAL column.
Use the scrollbar on the right of the report to see the remaining hours.
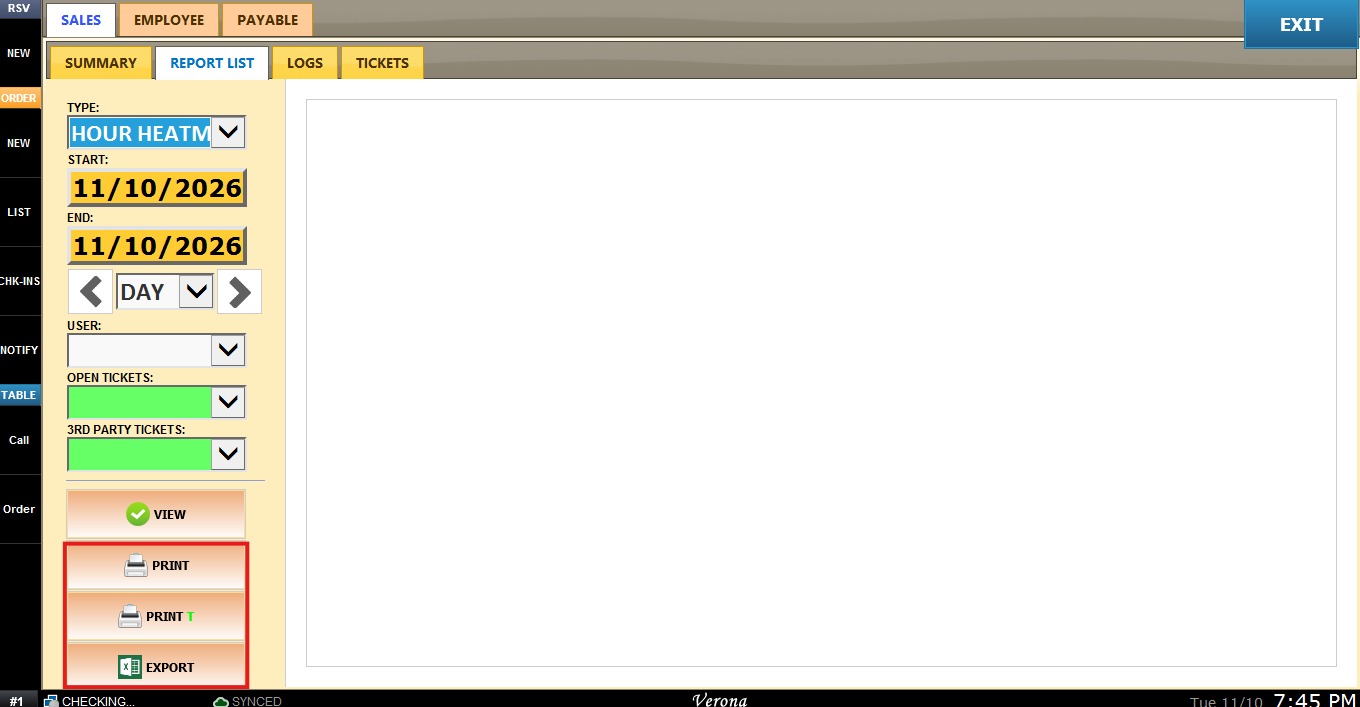
Click PRINT to print the report, or PRINT T to print it in receipt printer format. Click EXPORT to export the report to an Excel file.